A couple of weeks ago my good Twitter friend Pouya Bashiri shot me a message asking me if I wanted to collaborate on an fxhash piece. I was absolutely in for it! It was definitely very tricky to arrange his hand crafted tiles into a generative grid, but I also learned a lot about handling SVGs in p5 which required a lot of interaction with the DOM, which is not something I usually do. I really love how it ultimately turned out though!
What's an SVG?
I've never really worked with the SVG format prior to this collaboration, nor did I care much for learning about the format in the past, but I think I've fallen a little bit in love with it at this point since it offers a different angle from which you can approach creative coding.
SVG stands for 'Scalable Vector Graphic', which is immediately revelatory of two important properties: scalability and resolution independence. Unlike other pixel based formats, being Vector based, SVGs are not bound to an underlying pixel raster and can thus be scaled to arbitrary sizes, without loss of quality. After having struggled so much with scaling and resizing my p5 sketches in the past, this is genuinely a breath of fresh air.
Additionally SVGs are declarative and sit directly inside your html code. For example, this is how you would create a circle:
This is really cool, because now if we wanted to make alterations to the size, shape or color of the circle, we would just need to update the attributes of the circle element! This is quite different to drawing with Javascript's Canvas API, either with P5 or pure Javascript, where you would have to clear the canvas and redraw elements if you want to change or animate them:
SVG is an XML-based language for describing vector images. It's basically markup, like HTML, except that you've got many different elements for defining the shapes you want to appear in your image, and the effects you want to apply to those shapes. SVG is for marking up graphics, not content.
The tricky part here I found, was accessing the DOM and making these alterations. I believe that there are some libraries that make this easier however!
Zenozeng's SVG runtime for P5
The very first problem you run into when trying to load an SVG into P5, is that P5 does not natively support this. Sure there is the loadImage() function but you'll end up with a horribly blurry image of what formerly used to be a crisp and scalable SVG. Furthermore you'd miss out on all of the cool SVG attributes that would allow you to make changes to that SVG.
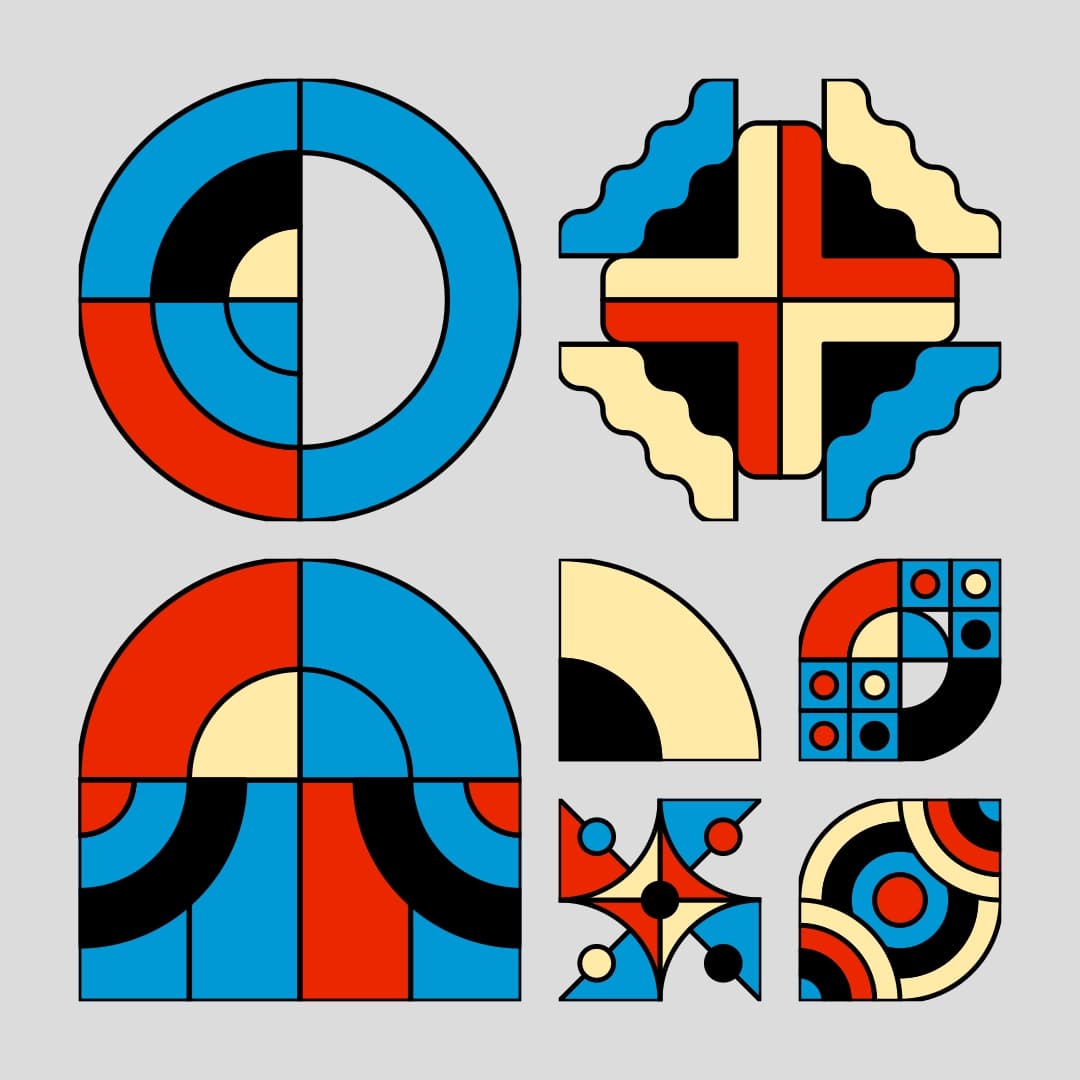
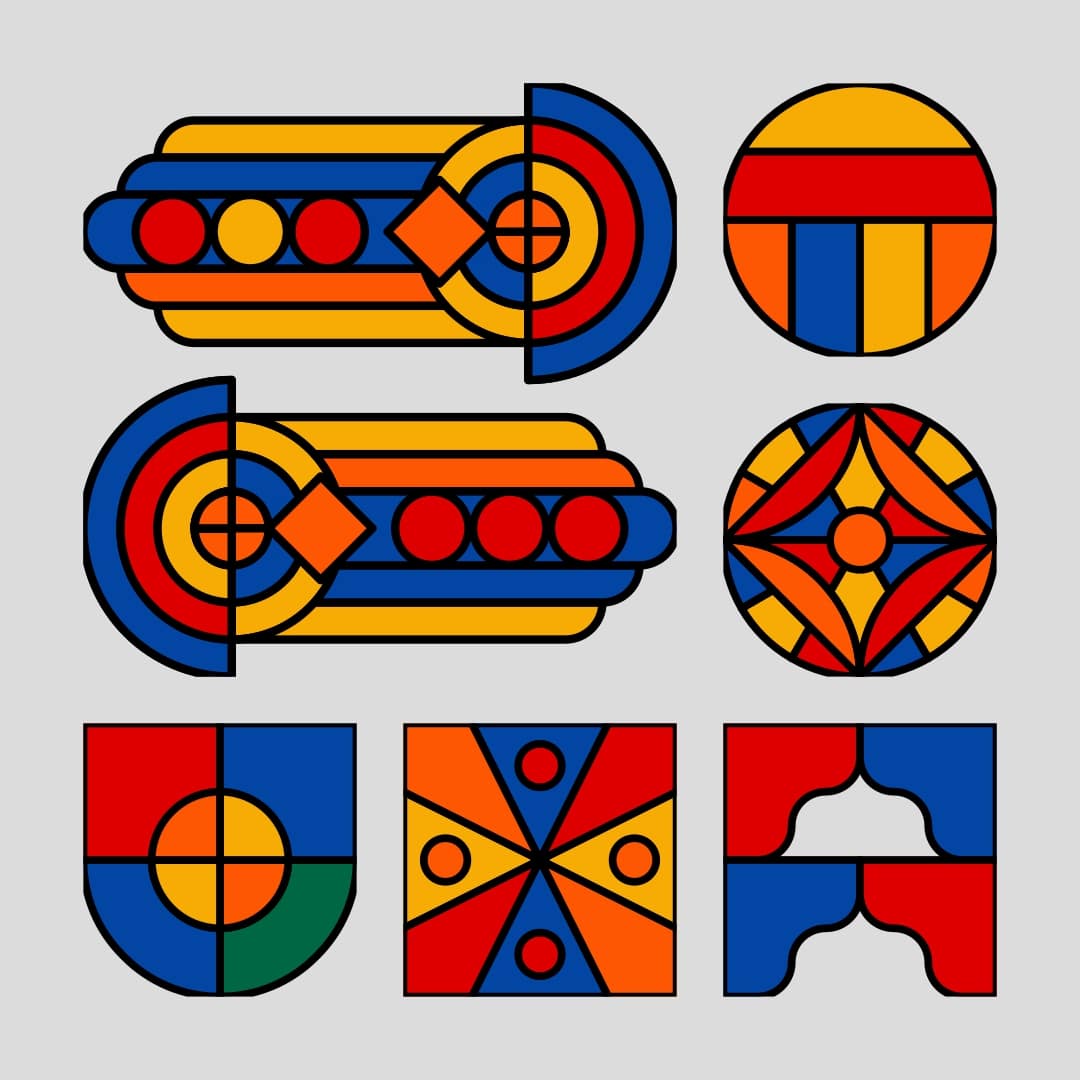
Pouya had sent me aroud 150 SVG tiles that he had me asked me to arrange on a generative grid. I hadn't anticipated that loading SVGs in P5 would even be a problem! I remember that SVGs had been discussed on the birbsnest discord server and a quick search revealed a link to Zeno Zeng's github repo 'p5.js-svg' which essentially provides an SVG runtime for P5.
And it's very straight forward to use, you can find the repository here. Essentially you simply add this script tag to your index.html:
<!-- you might have to change the version number in the future -->
<script src="https://unpkg.com/p5.js-svg@1.3.1"></script>
And go about your P5 sketch as usual, with one little change to the createCanvas function, such that instantiate it with the SVG runtime:
function setup() {
    createCanvas(100, 100, SVG);
    background(255);
    fill(150);
    stroke(150);
}

function draw() {
    var r = frameCount % 200 * Math.sqrt(2);
    background(255);
    ellipse(0, 0, r, r);
}
Similarly to running P5 in WEBGL mode, here we pass a third argument to the createCanvas() function specifying that we want to the sketch with the SVG runtime. Inspecting the page we find that instead of having attached a <canvas> element to the body, we find that there's now an <SVG> instead! Now all the regular functions that usually draw shapes should create SVG elements and append them rather than drawing them to the canvas!
Creating the Grid
Pouya had sent me two types of tiles within two folders, one labeled 1x1 and another labeled 2x2. The 2x2 tiles usually had a lot more going on and didn't look right when shrunk down, this was the perfect opportunity to use my irregular grid code. I rewrote the code to be invokable as an object like so:
// create the grid handler
// gridDivsX and gridDivsY are the dimensions of the grid
let G = new makeGrid(gridDivsX, gridDivsY)

// creates the boolean grid
G.setupGrid()

// populates this grid with rectangles
// stored in an array named rectInfo
G.populateGrid()
Now we can easily fetch information about the grid from it's member variables! For the final sketch gridDivsX and gridDivsY are always equal, meaning that the grid will always have the same resolution on both axes. The rectangles are also always squares, I did not find a way to stretch the tiles horizontally or vertically (I also didn't think that it would look good).
I'm skipping over some things here, but essentially the next step is looping over the grid and assigning each position a tile. Note that 'buff' here stands for the graphics buffer that I'm drawing to:
for(let n = 0; n < G.rectInfo.length; n++){
  let R = G.rectInfo[n]

  // if the rectangle occupies patches that are larger than 1x1
  // we select one of the 2x2 tiles otherwise a 1x1 one
  let randSVG;
  if(r.dimX>1){
    randSvg = random(svgs2)
  }else{
    randSvg = random(svgs)
  }

  // Calculate position and correct dimensions
  var x = r.posX * gSX + pad
  var y = r.posY * gSY + pad
  var wid = r.dimX * gSX
  var hei = r.dimY * gSY

  // Draw the tile
  buff.image(randSvg, x, y, wid, hei)
}
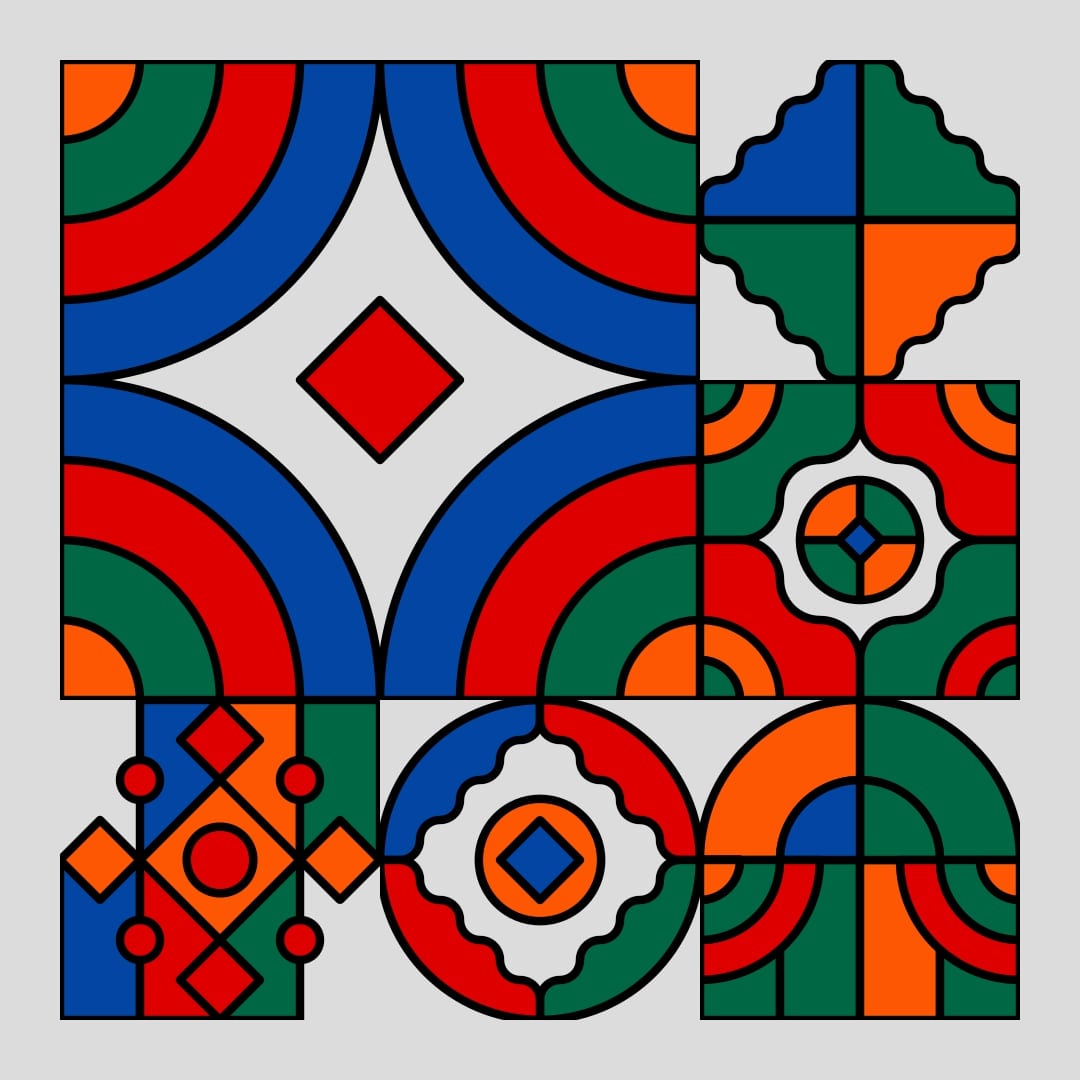
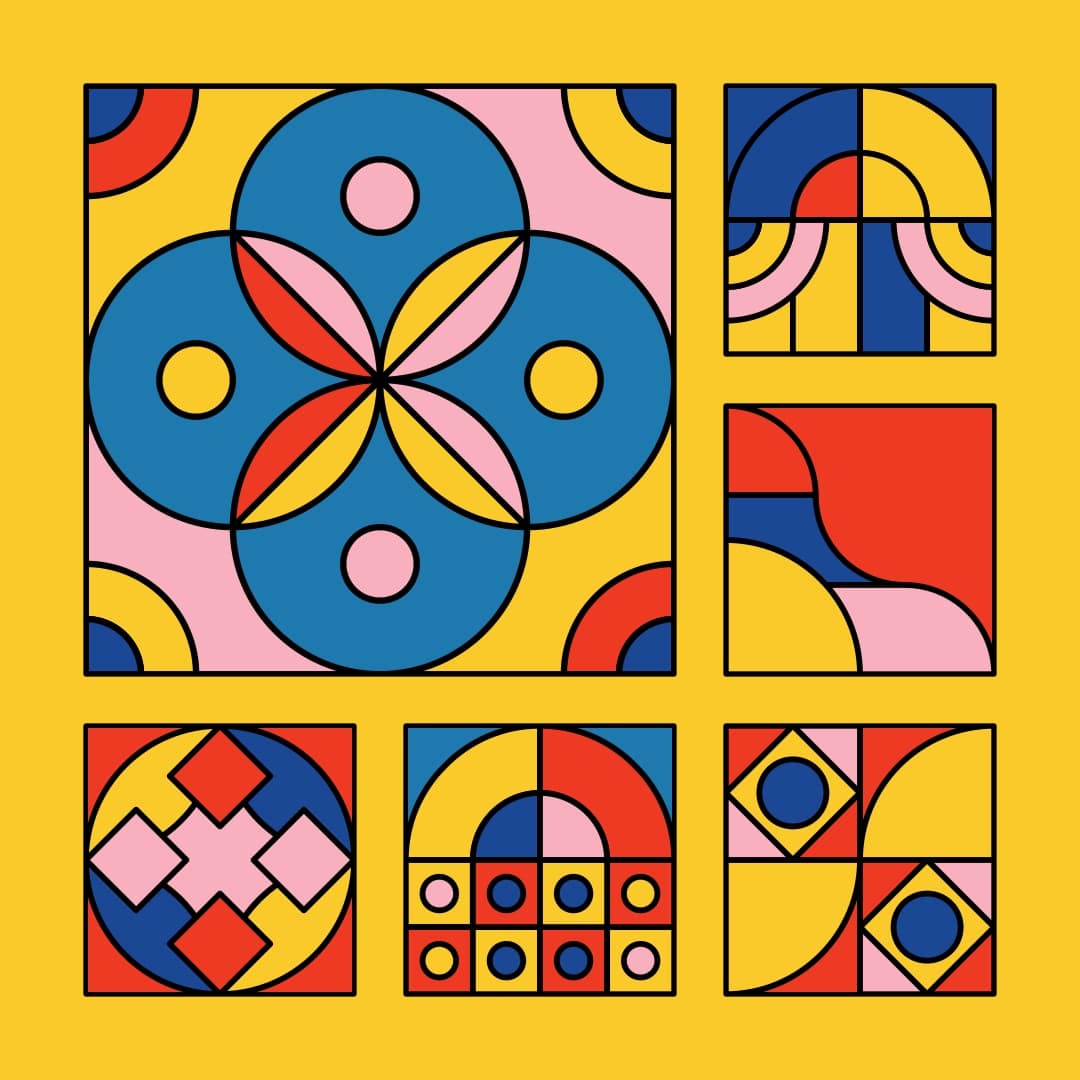
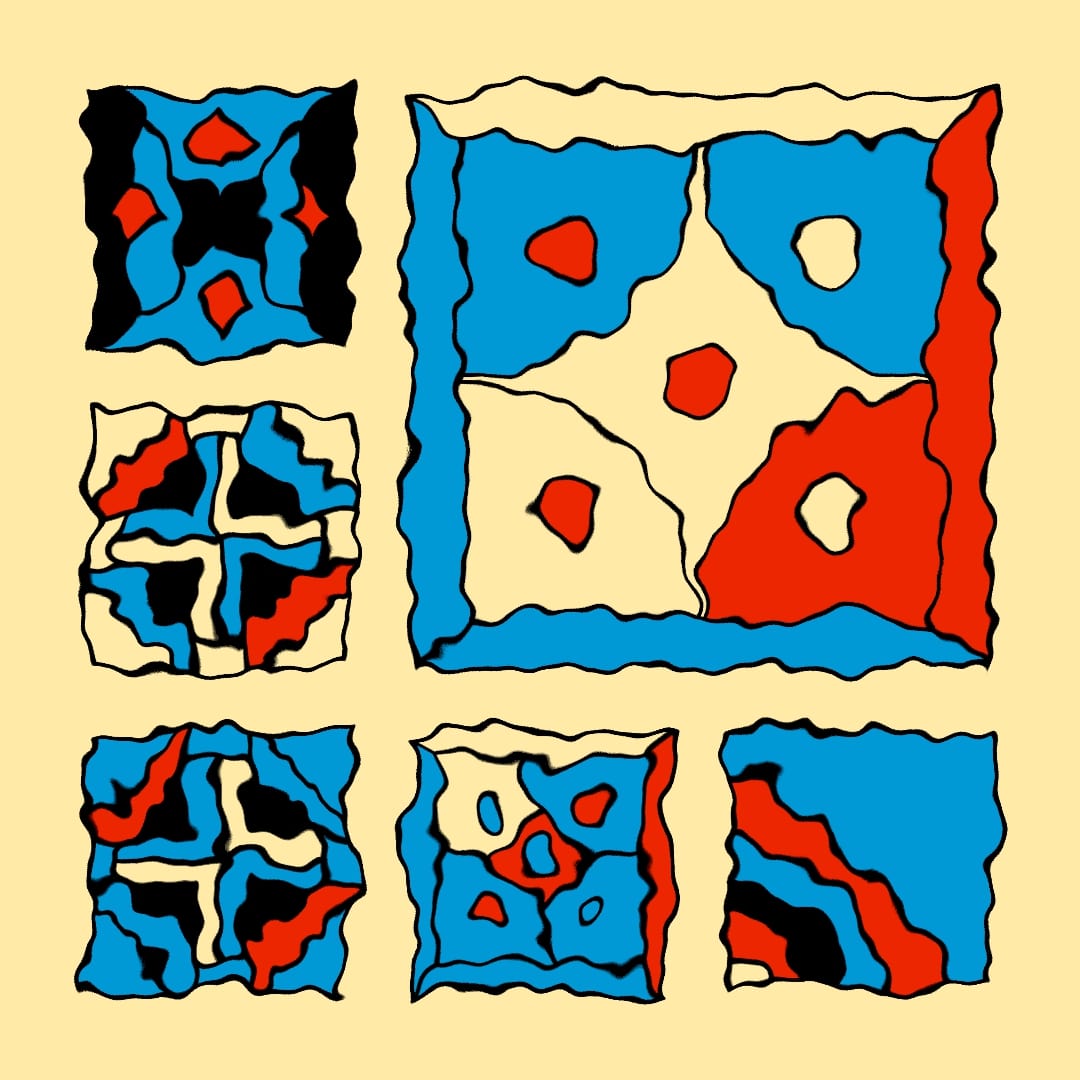
Let's have a look at what we've got so far! Running the code we've written so far we'd end up with outputs that look as follows:
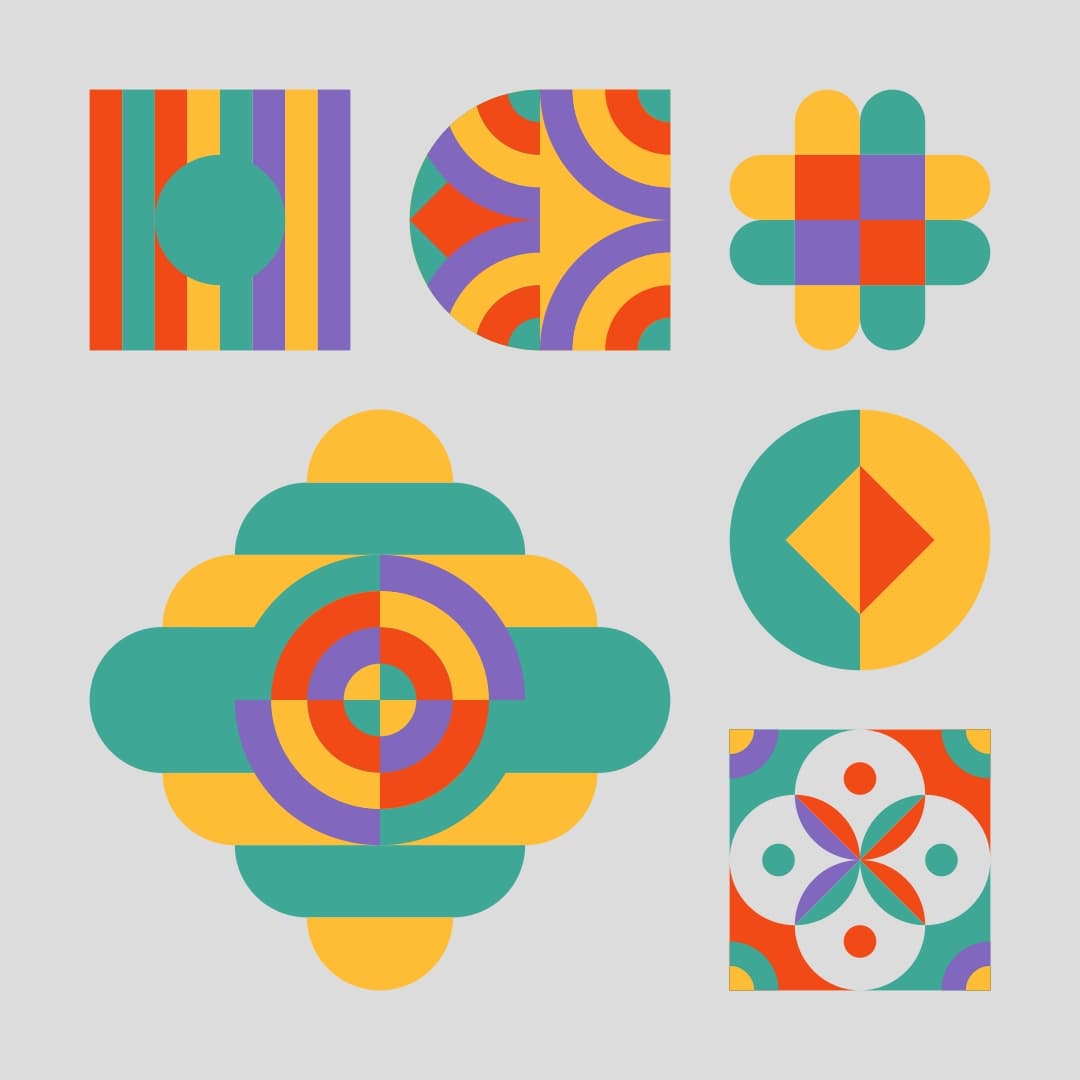
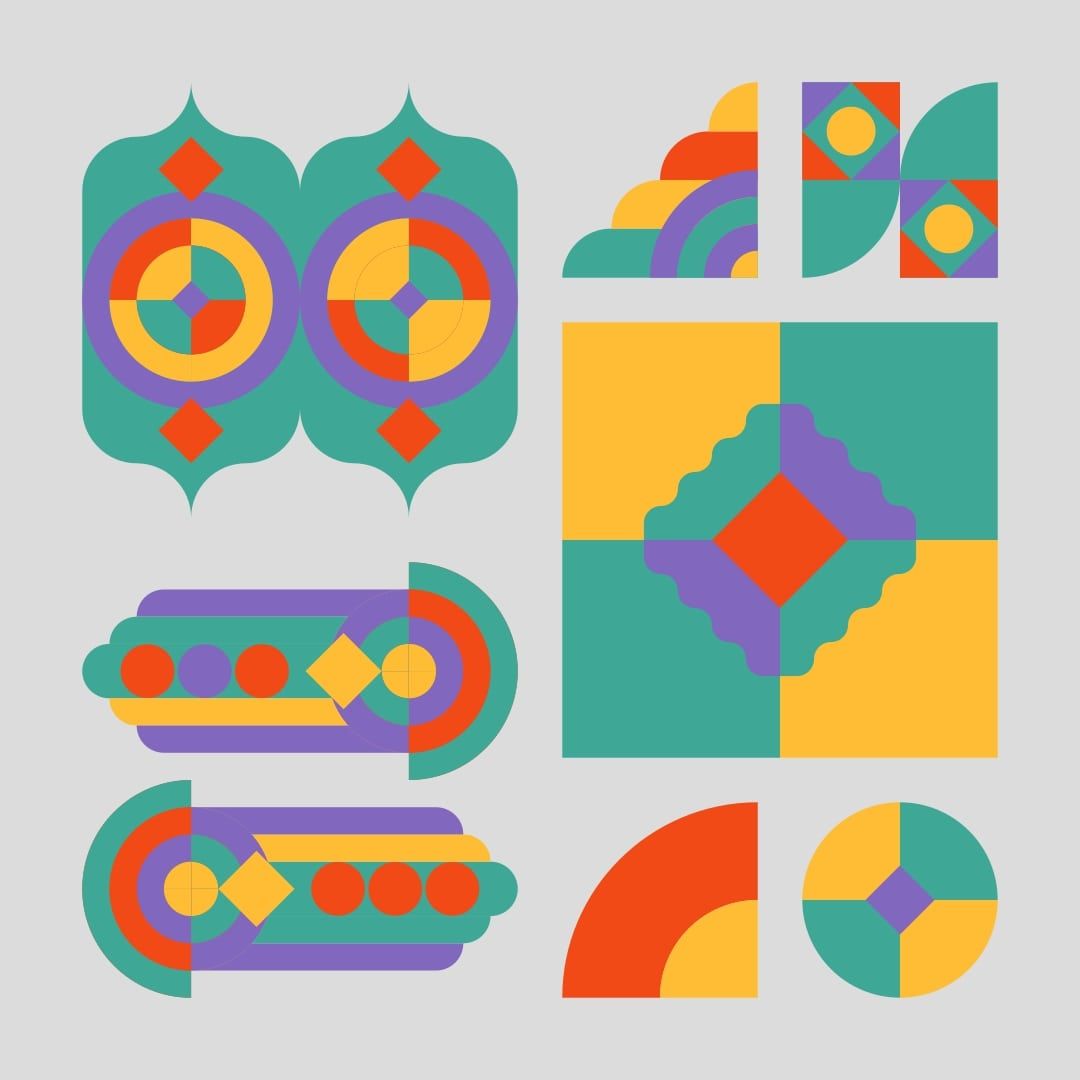
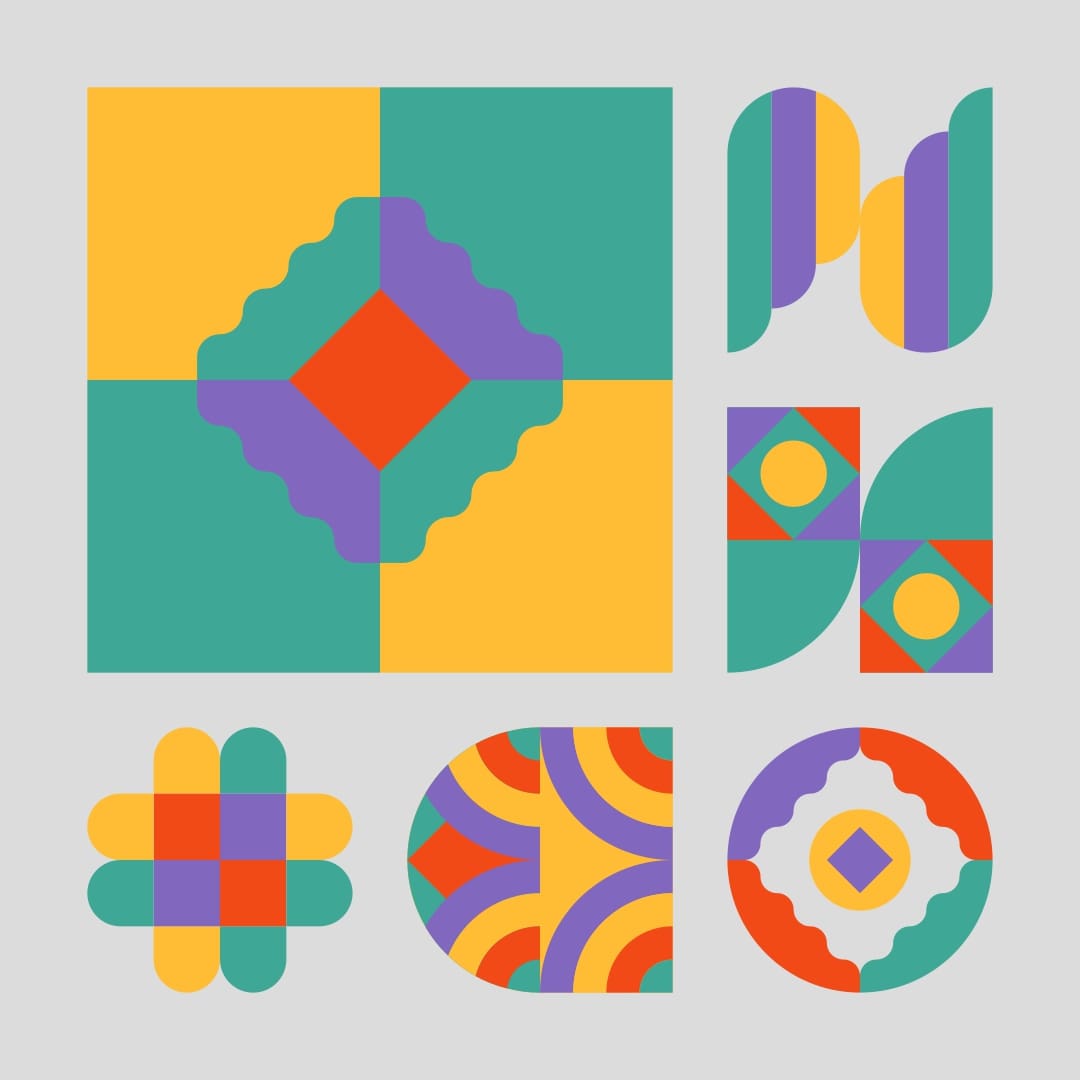
This is still very far from looking like something mintable. We need to add some strokes and colors! The SVGs already had a pre-determined color assigned to each element (the palette you see in the images above), we can use that to our advantage by mapping a new color to each one of them!
Accessing DOM elements
The tricky part of adding attributes to the tiles is finding them in the DOM. The way I ultimately did it is very straightforward. After inspecting the generated SVG a bit I noticed that most shapes are contained within a tag, which is essentially a container tag that serves to group other elements together. This essentially allows us to fetch all of those tags with the following command:
var g_elements = document.getElementsByTagName("g")
This essentially returns a list of all of these tags. Now we can go over this list and find the major types of shapes that occur, after a little bit of visual trial and error I found that there were only 5 types, mainly elements, but also , , and . We can now get each on of this with the same command:
var paths = g_elements.getElementsByTagName("path")
Now we can again go over these elements and easily access their attributes:
for(let n = 0; n < paths.length; n++){
    paths[n].setAttribute('stroke', strokeCol)
    paths[n].setAttribute('stroke-width', sw) // sw is a global strokeWeight parameter

    var col = paths[n].getAttribute('fill')
    colorFlipper(paths[n], col)
}
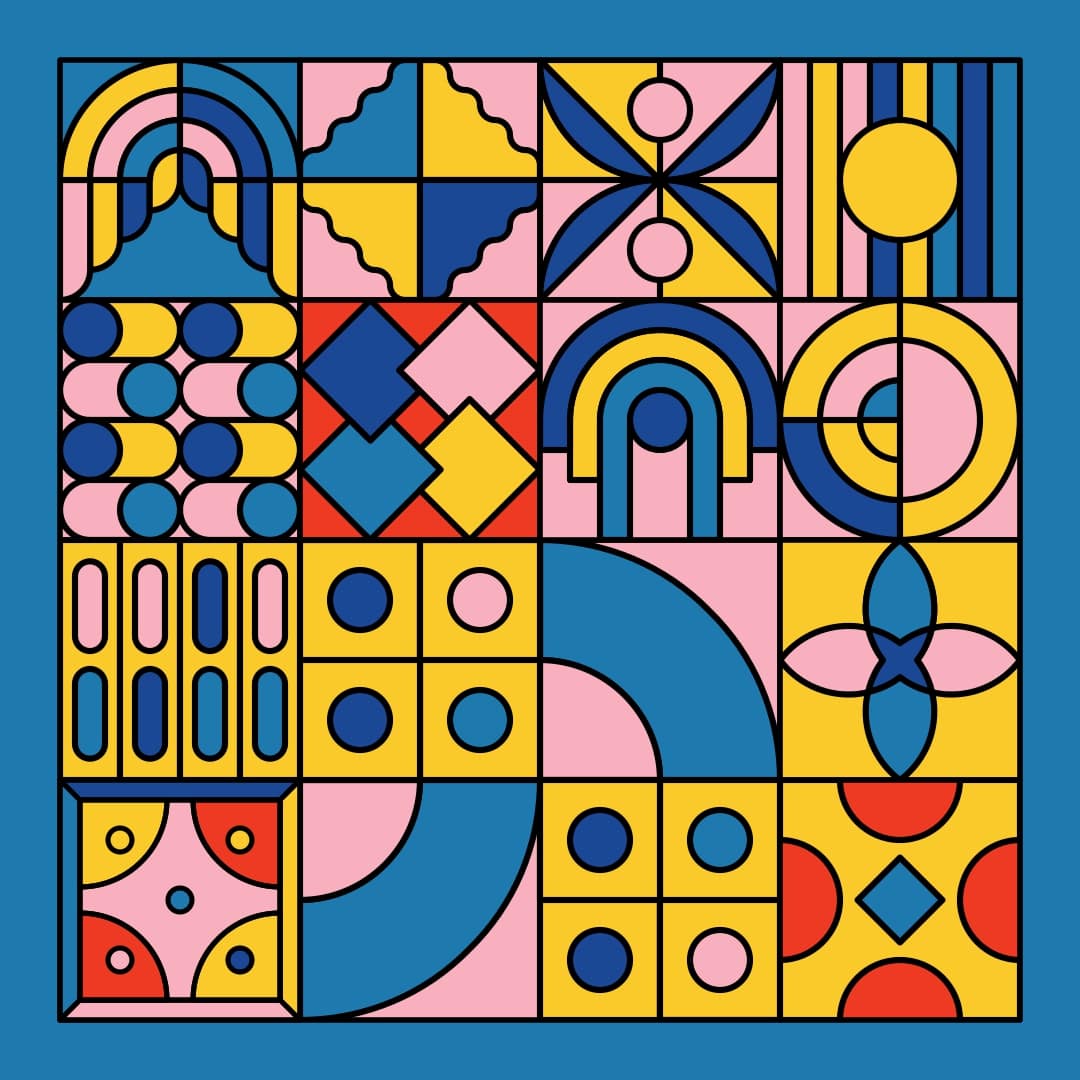
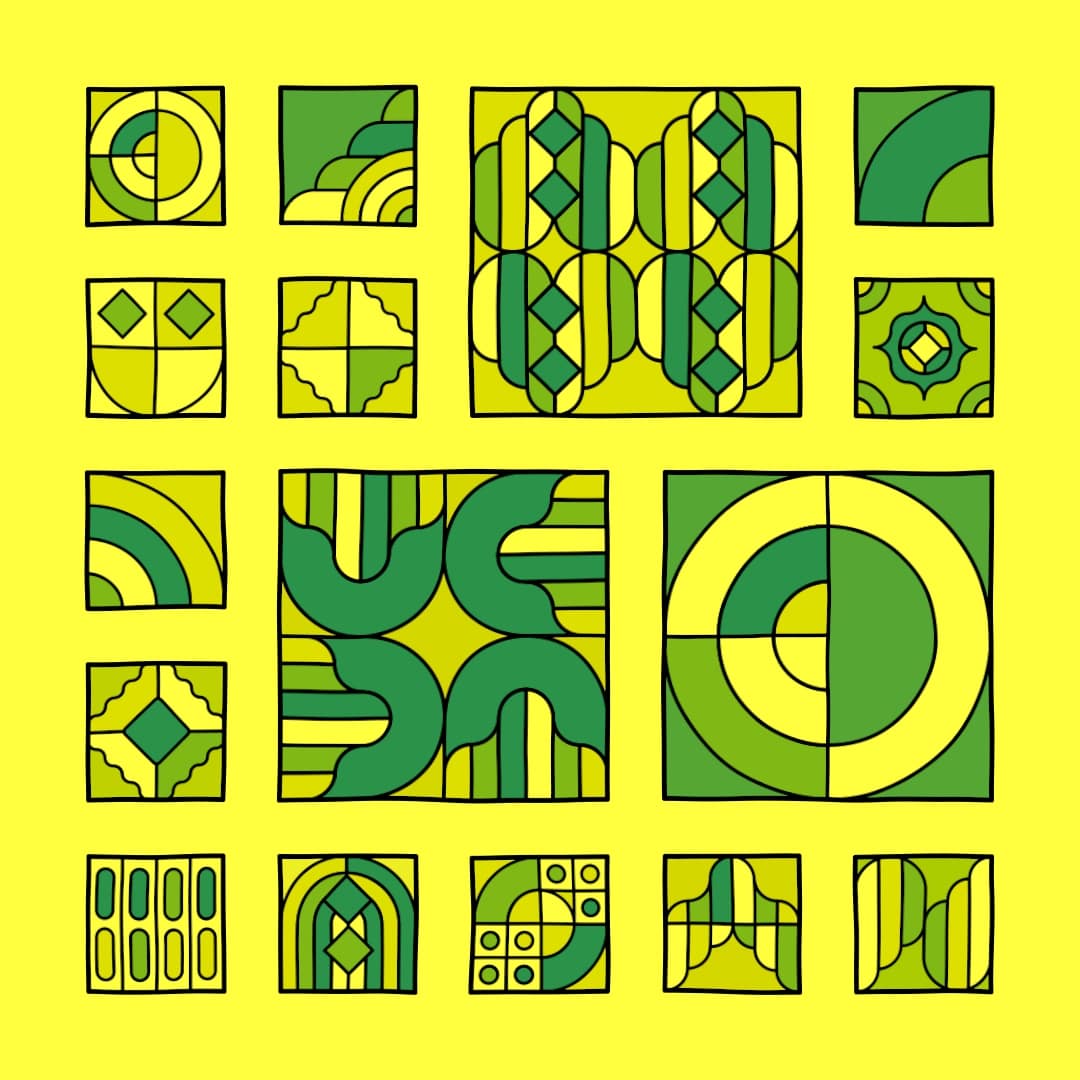
I also wrote a function to swap out the color with another from a palette that we determine at the beginning of the code. I'm pretty sure that this isn't the prettiest or cleanest code, but hey... it works! Let's have a look at what it looks like now after adding strokes and changing the colors:
This already looks much much better! Now there's a little problem here where the strokes at the borders of the tiles is cut off, this is caused by the strokes exceeding the size of the containing viewbox. This can be resolved in two manners, either unwrapping the shapes contained in this SVG into a larger SVG with a viewbox that encompasses the entire screen, or we can simply hide it by drawing a stroked rectangle on top of it. Since I didn't understand the viewbox problem until much later on, I chose to fix with the latter solution. We can simply add some rectangle drawing code to the loop where we pick which tiles to draw:
// inside the for loop

// Draw a colored rectangle we will place the tile on top of it
buff.fill(random(palette))
buff.noStroke()
buff.rect(x, y, wid, hei)

// Draw the tile
buff.image(randSvg, x, y, wid, hei)

// Draw another stroked and empty rectangle on top
buff.noFill()
buff.strokeWeight(10)
buff.stroke(0)
buff.rect(x, y, wid, hei)
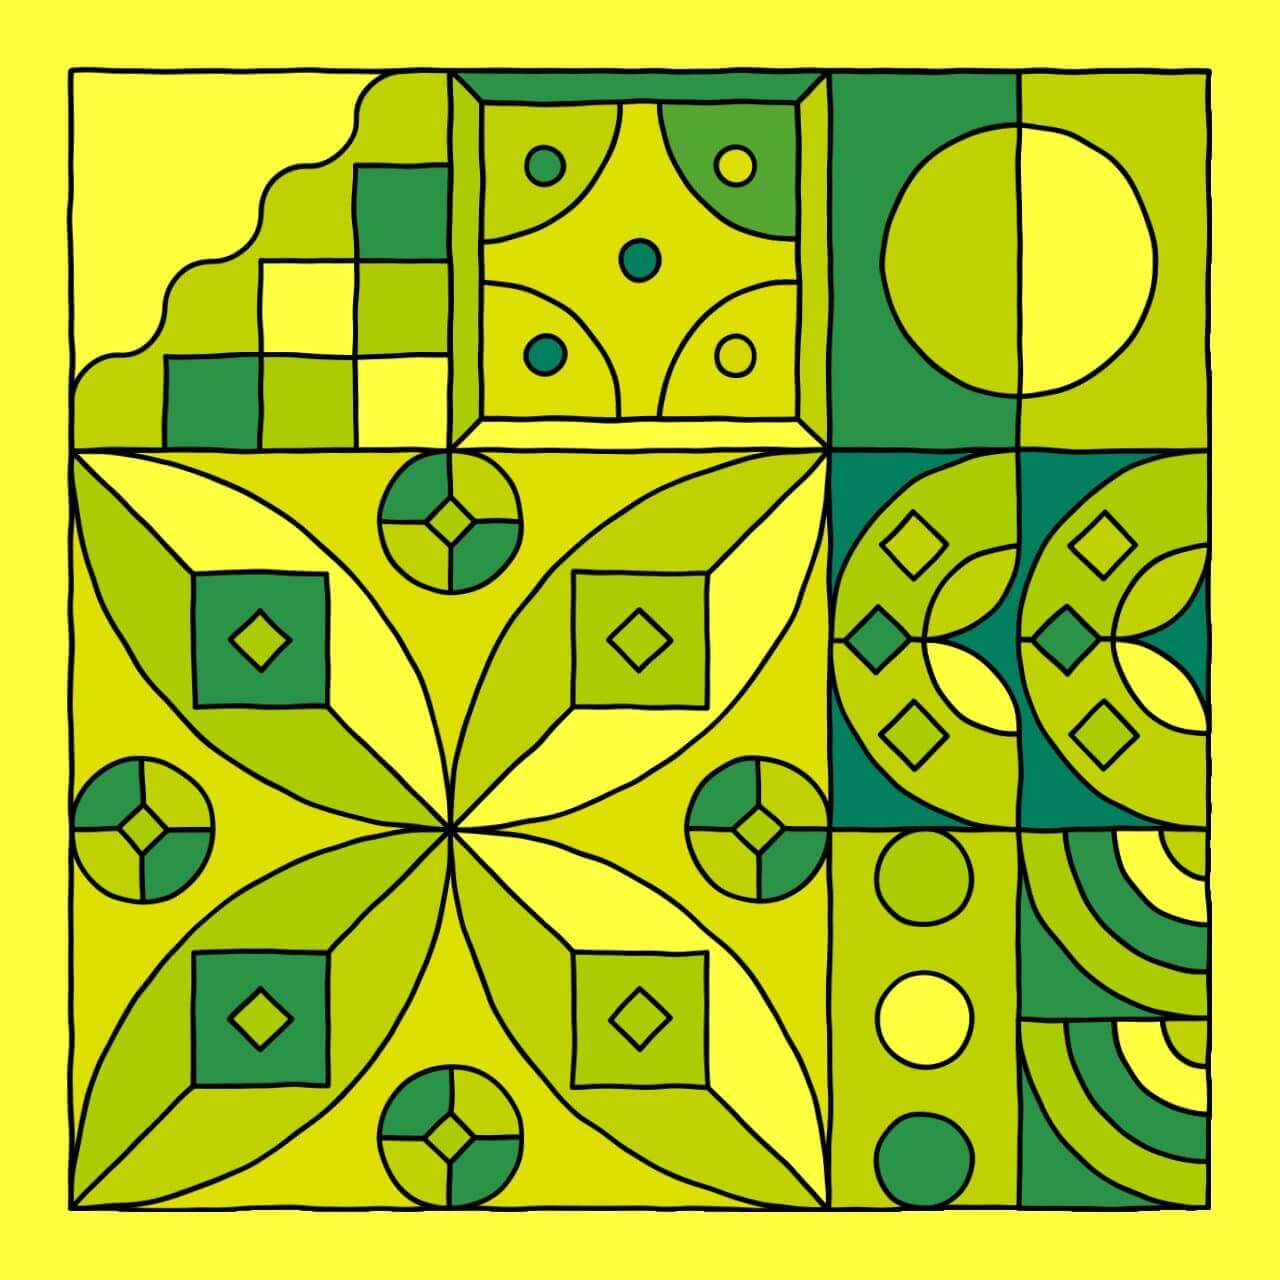
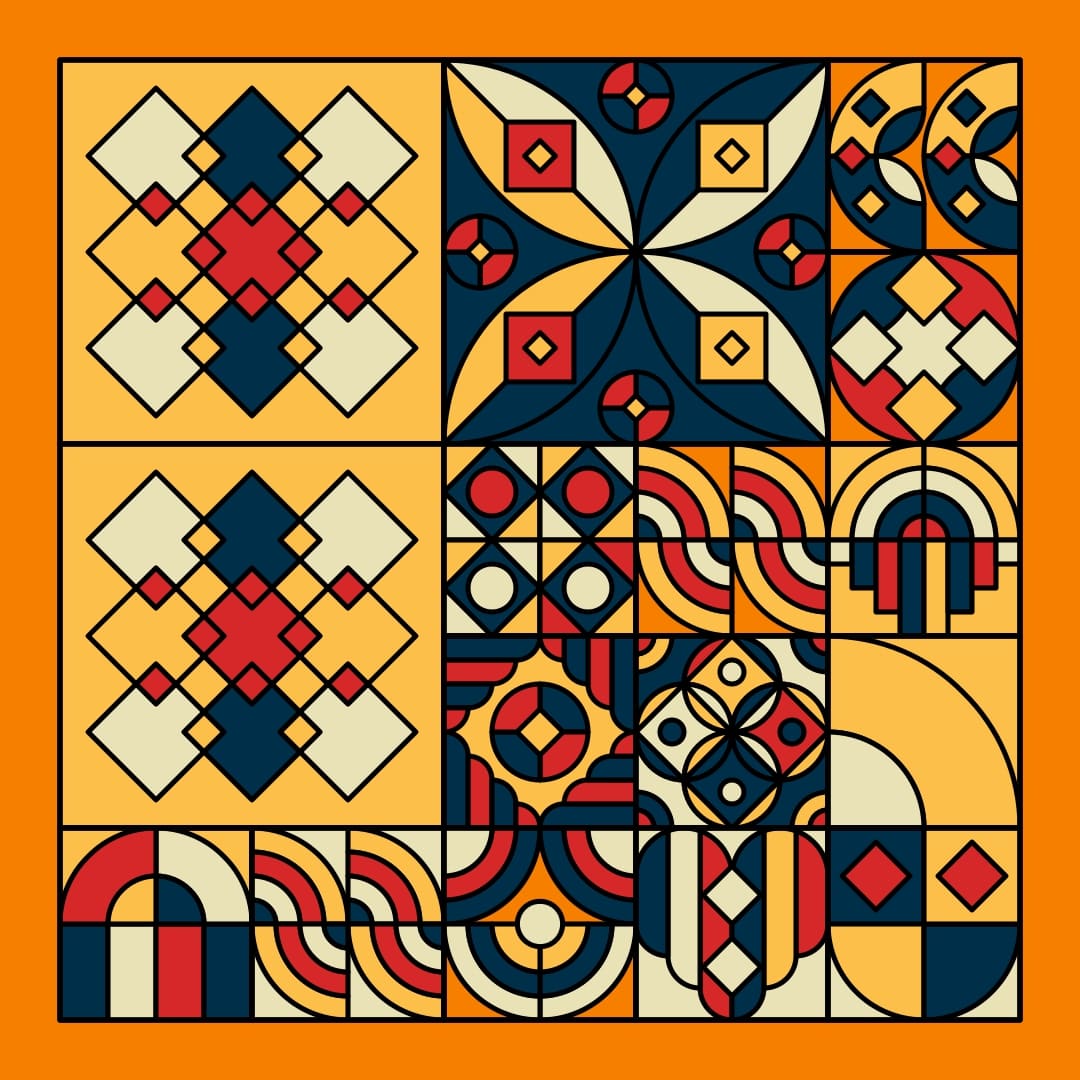
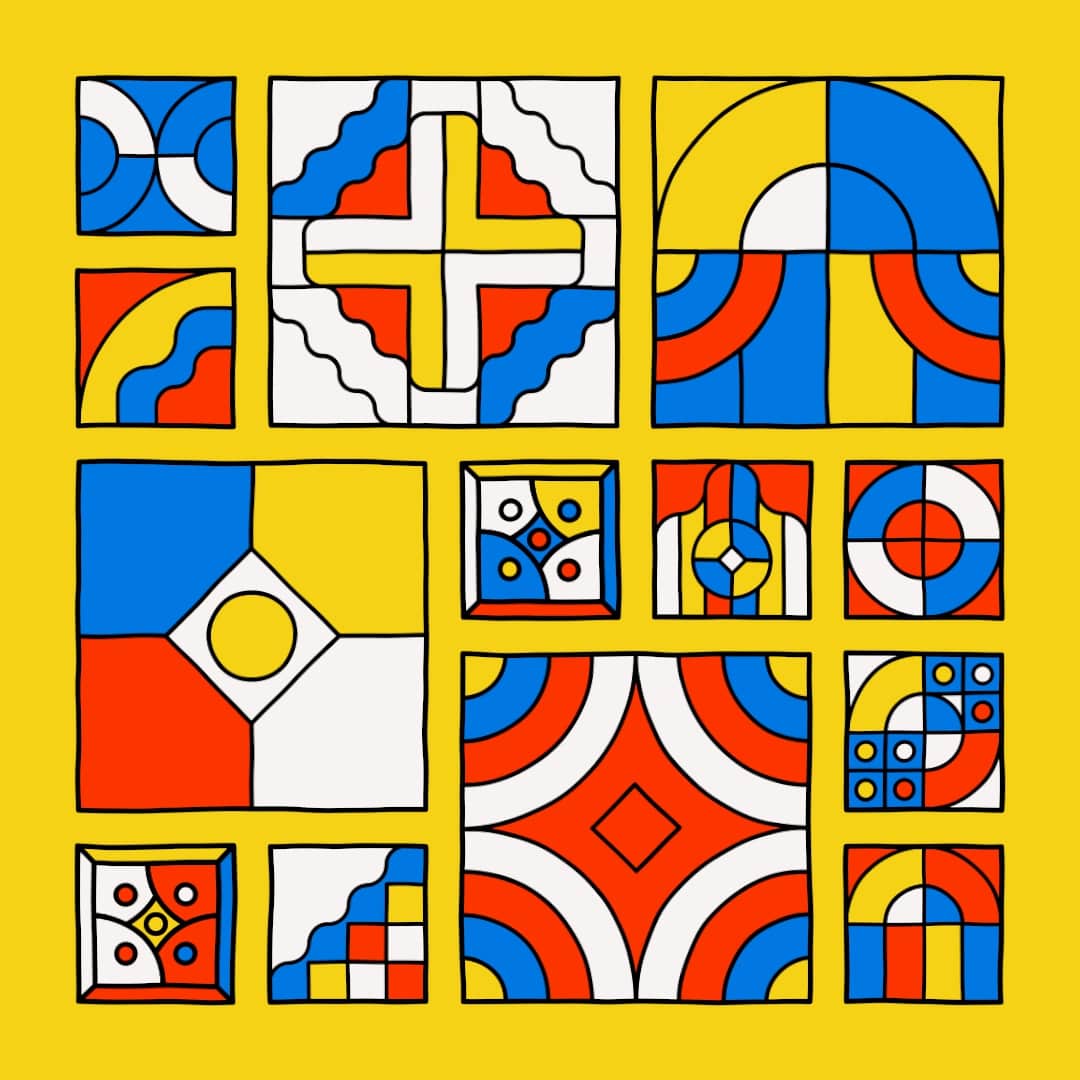
And we end up with something that looks like this, let's also add some colour to the background:
SVG filters
Working with SVGs also unlocks the ability to utilise SVG filters, there's a number of them each of which has it's own interesting effect. I discovered them while I was on the search on something that would allow me to add a grainy effect, which ultimately I couldn't figure out because the p5 pixel array functions don't really work in SVG mode. I came across the feTurbulence filter which allows you to deform shapes, in all sorts of manners. This effect can range from subtle to very distorted:
To be able to use this filter we need to attach it to the DOM as well, I'm not very knowledgeable about where the 'correct' place is to attach the filter, but I plugged it in at the top of the main tag, like so:
g_tag = document.getElementsByTagName("g")[0]
g_tag.innerHTML += ''
Then we can apply this filter to a certain shape or a grouping of shapes by adding it as attribute:
group.setAttribute('filter', 'url(#f)')
Initially I added this attribute to each individual shape in the SVG, this caused the sketch to become incredibly slow. It's much better to place all the shapes in a global tag and apply the filter to it!
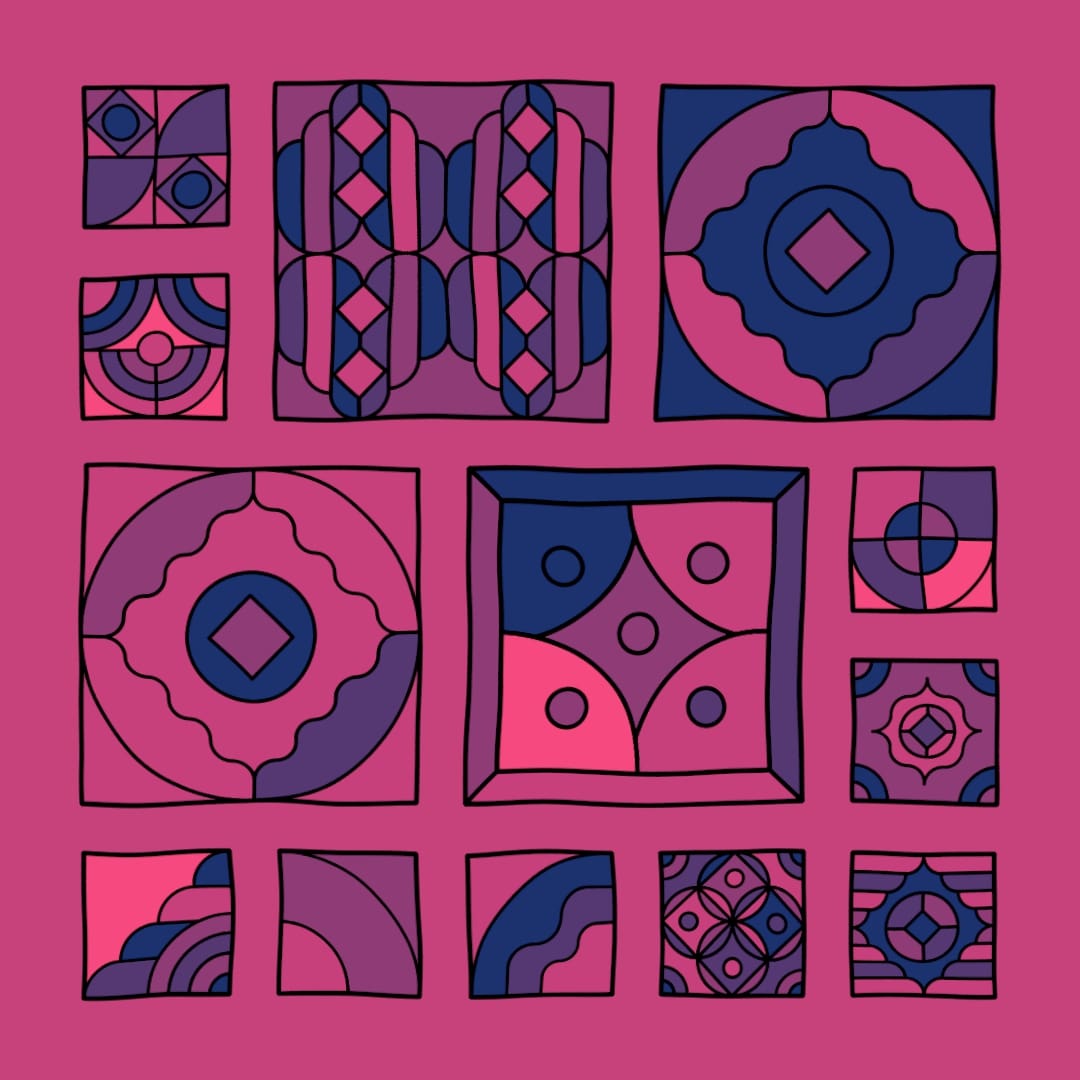
You can read more about the filter parameters here, but essentially the two parameters that I played with the most were the baseFrequency, which essentially controls the warbliness of the filter, as well as the scale parameter, which controls the magnitude of the effect. I only cranked these parameters a little amount, to give the shapes an almost hand drawn feel:
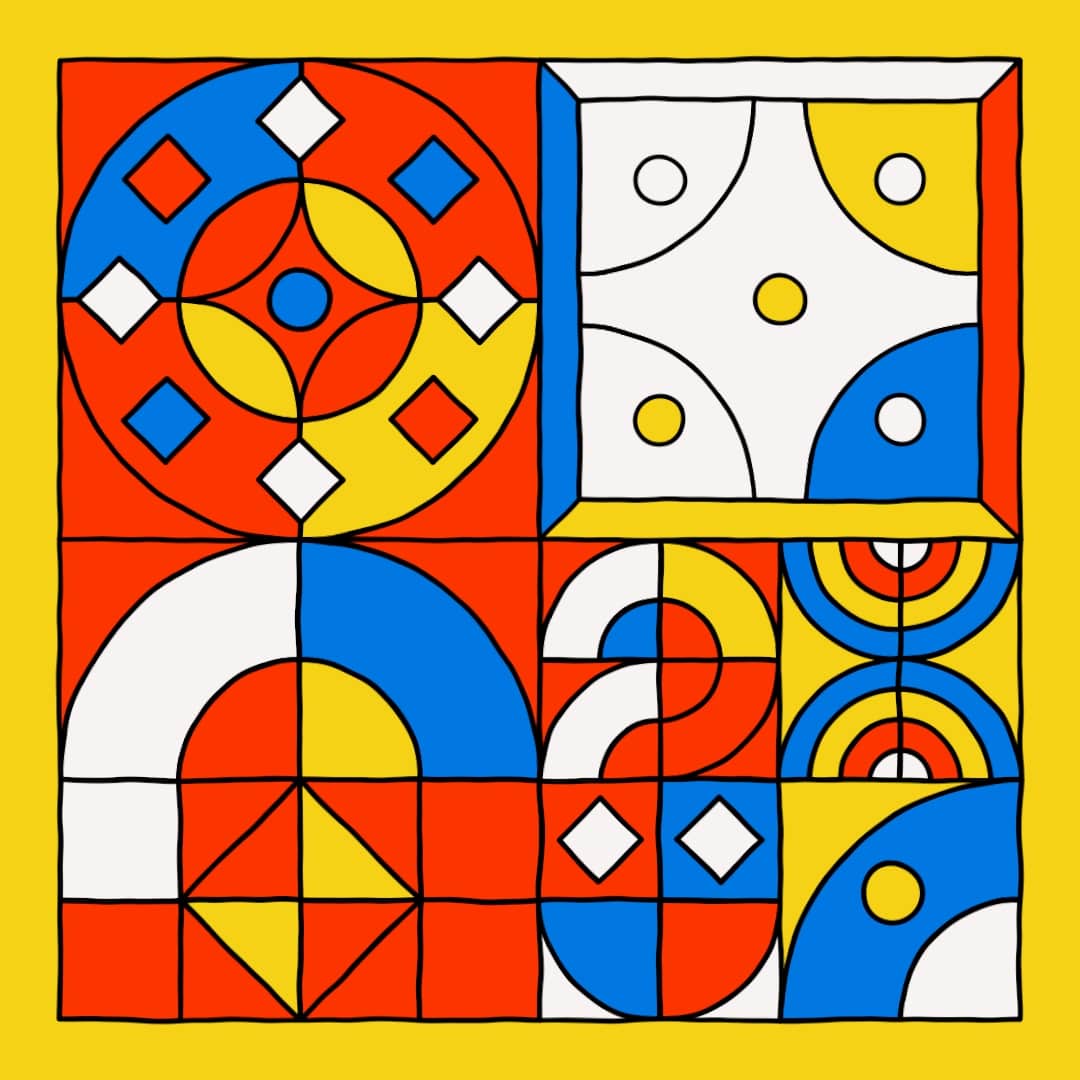
Combining these noisy strokes with a thicker strokeWeight just felt right and gave it a playful feel. I strive to make my art look like it was made by a very talented toddler lol.
SVG graphics buffer and clearing the canvas
This issue was really frustrating because I couldn't pinpoint why the sketch was behaving the way it did. I was only able to wrap my head around it after getting some help from @antigoon and @dave.
I don't know why it took me so long to figure out what was going on, but it's a mixture of unintuitive behaviours. In the regular P5 runtime, I have the habit of not drawing a background when drawing a graphics buffer to the canvas, since it will be drawn over what's on the canvas already.
The SVG runtime works in such a way that the 'canvas' doesn't get cleared if you don't call the background() function, or alternatively the clear() method. Here the latter is mentioned in the documentation, but didn't work for me, renderer.drawingContext.__clearCanvas(); however did the trick, where renderer is the canvas stored in a variable.
Note that the graphics buffer also needs to be instantiated with the SVG mode for it to be compatible:
pg = createGraphics(size, size);
Drawing this buffer to the canvas in the draw loop, will result in it being attached over and over again to the DOM:
function draw(){
  image(pg,0,0,w,w)
}
To solve this clearing the canvas was required, with either one of the two methods I mentioned. Here's a minimal example:
let renderer;
let pg;
let pg_size = 1080;

function setup(){
  w = min(windowWidth, windowHeight)
  renderer = createCanvas(w, w, SVG)
  pg = createGraphics(pg_size, pg_size, SVG)

  pg.ellipse(pg_size/2, pg_size/2, 50)
}

function draw(){
  // clear() didn't work for me
  // comment this out and halt execution
  // it will have added many svgs
  renderer.drawingContext.__clearCanvas();
  image(pg,0,0,w,w)
}
One unexplainable issue that remains, which has still got me scratching my head, is why it doesn't behave in the same manner (adding many SVGs that is), when I use a boolean toggle to halt execution after resizing the canvas:
let renderer;
let pg;
let pg_size = 1080;

let resizeToggle = true

function setup(){
  w = min(windowWidth, windowHeight)
  renderer = createCanvas(w, w, SVG)
  pg = createGraphics(pg_size, pg_size, SVG)

  pg.ellipse(pg_size/2, pg_size/2, 50)
}

function draw(){
  //renderer.drawingContext.__clearCanvas(); // clear() didn't work for me
  if(resizeToggle){
    image(pg,0,0,w,w)
    resizeToggle = false
  }
}

function windowResized(){
  w = min(windowWidth, windowHeight)
  resizeCanvas(w, w)

  resizeToggle = true
}

function keyPressed(){
  if(keyCode === DOWN_ARROW){
    noLoop()
  }
  if(keyCode === UP_ARROW){
    loop()
  }
}
My theory is that resizeCanvas() has a clear() attached to it, that prevents this behaviour. In any case it's probably best to clear the canvas in some manner before redrawing, and making sure that your SVG isn't blowing up!
SVG Runtime vs Canvas API
It really doesn't make much sense to compare the two, because you'll probably use one over the other depending on what you want to achieve. For the most part, I miss having access to the pixel array in the SVG run-time, mainly for the purpose of adding grain. There are however some ways to add grain that I'll have to explore in the future.
I do love the SVG format though, it's generally small and the scalability is a big plus, especially for a generative token. I often get messages asking for high rez versions of the token, which I don't really have, giving the collector the option to download an SVG however solves all of that, they can scale it however they want, and they could also technically edit certain attributes to their liking!
And that's pretty much it from me this time around again! If you enjoyed this post, consider sharing it with your friends, it helps out a lot! Or come and say hello on Twitter! Happy Sketching!