This time around we'll code up the cute minimalist sketch above! We'll have a look at some useful concepts upon which you can build a variety of different sketches. Quick index goes here:
- A Boolean Grid
- Adjustable canvas size
- Drawing the Grid
- Drawing a Connected Path
- Adding Detail
- Animating the Sketch
- Perfectly Looping Sketch
A Boolean Grid
We'll start off with creating a boolean grid. This won't make much sense at this point, but it's essentially what the entire sketch builds upon. In a nutshell, the grid will determine the positions into which we're allowed to draw:
function setup() {
  w = min(windowWidth, windowHeight)
  createCanvas(w, w);

  padding = 30
  spacing = 5

  bools = []
  for(x = padding; x
At this point I've covered grids countless times in my blog posts, and yet again we'll make use of one! Here we're creating a 2D array that we fill with zeroes. It's size in width and height are determined by the parameters that we specify beforehand: padding and spacing. I used to call these 'off' and 'spc' previously, but for sake of clarity these make a lot more sense. Padding is essentially the horizontal and vertical distance between the border of the canvas and the grid itself. Spacing is simply the distance between points in the grid.
Adjustable canvas size
Before we go any further into the details of this sketch, I'd like to make an adjustment to the manner in which we create the grid. What if we would like to have a grid that is not square in shape? For instance we would like to have a wide aspect ratio or portrait aspect ratio?
We could do something like this:
w = min(windowWidth, windowHeight)
wx = w
wy = w
createCanvas(wx, wy);
In this manner we can now simply add a scaling factor to either the width of the height of the canvas to get the desired shape. So for example if we want a 16:9 aspect ratio:
w = min(windowWidth, windowHeight)
wx = w*1.6
wy = w*0.9
createCanvas(wx, wy);
Neat right? I've been using this trick to get differently sized images when posting to Twitter! And naturally we'll need to account for the different width and height of the canvas and modify the loop that creates the boolean grid:
bools = []
for(x = padding; x
Our code would now look as follows:
This doesn't draw anything yet but bear with me!
Drawing the Grid
Now we've got the boolean grid, but we're not storing the location of the dots anywhere, we can however make use of the padding and spacing parameters as well as the dimensions of the grid to determine the positions:
function draw(){
  for(i = 0; i
Running this code will draw a grid of points to the canvas now:
Drawing a Connected Path
The next thing we'd like to do, is drawing a connected path horizontally through this grid. We can do this by setting a random entry in each column to be true and then connecting these entries with lines. First things first, how do we set a random value in each column to true? We could do this during setup:
bools = []
for(x = padding; x
Making sure that we did this correctly, we'll draw an ellipse at these grid locations:
Looks good! Next we'll want to connect these grid locations with a line. For this we need to remember the location of the previous true entry in the grid, we can do this with some spare variables prevI and prevJ:
Now you see, this doesn't look that nice to be honest. The peaks and troughs are all over the place. It would look much nicer if this path was a little smoother and controlled. We could do this by replacing the random selection of the row index with perlin noise:
rez = 0.01
randomRowIndex = int(noise(x*rez,y*rez)*row.length);
If you're not familiar with the magical p5 noise() function have a look at this tutorial I've written.
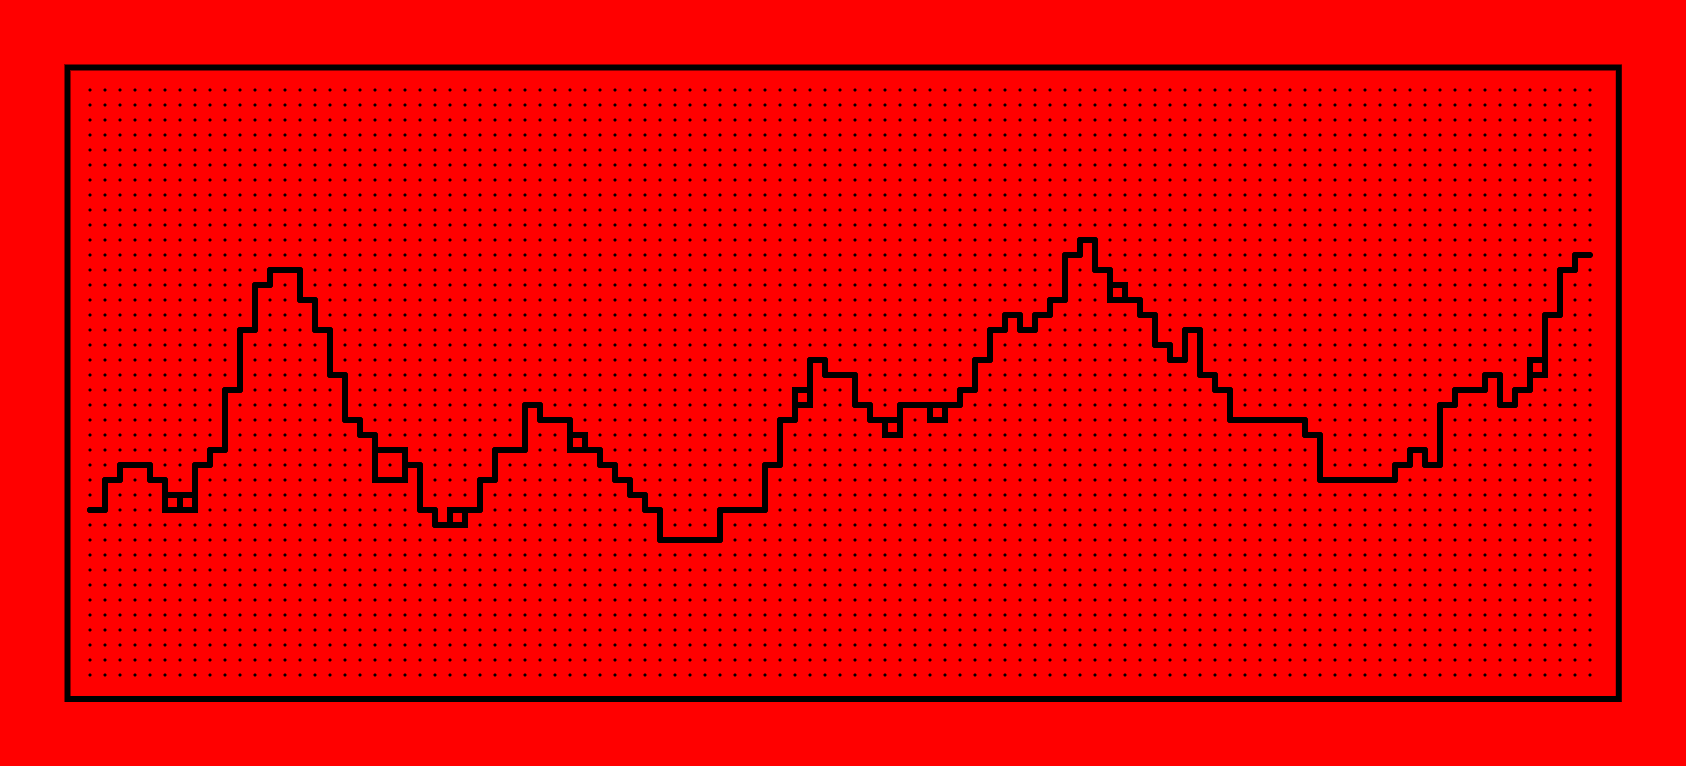
The rez variable here stands for resolution, and specifies how fine we want this perlin noise to be. The lower the rez arameter, the smoother the path. We'll give as input the x and y location of the grid point, but you can alternatively feed in other variables. We'd get a result that looks as follows:
This looks much better. Also notice that I adjusted the strokeWeight of the line and the points as well as the spacing in between them. This way things look much neater, to me at least. Feel free to make some changes and @ me on Twitter!
Adding Detail
This is actually already the bulk of this sketch, but we can add a couple of ornaments to make things a little bit more interesting. For example adding a little rectangle here and there that looks like a boulder:
if(random()>0.9){
  rect( (i-1) * spacing + padding,
        j * spacing + padding, spacing)
}
And some rain drops coming from the sky above the mountains. For this we'll need to check if we already drew the horizontal line, if we did we toggle the boolean variable 'below' to stop drawing rain drops:
if(random()>0.9 && !below && j>0){
  line(i * spacing + padding, j * spacing + padding,
      i * spacing + padding, (j-1) * spacing + padding)
}
And the code goes here:
This already makes for some nice little images, but we can take this further!
Animating the Sketch
First we'll want to comment out the noLoop() statement in our code. Then we'll want to add a background(255) to the top of the draw loop. If we ran our sketch this way, you'll notice that the location of the rain drops will be randomized each frame, making it appear as if they are falling with a high speed. You'll also notice that the randomly placed rectangles (boulders), will jump around erratically, to fix that we can simply replace the random() statement in the if condition with noise(), for some pseudo persistence:
Next we'd like to animate the mountainscae, such that perlin noise path slides from right to left, as if we were somehow sitting inside of a car filming the view of the distant mountains. Take a moment to think how you could achieve this.
We've basically written our sketch in two parts, one that draws a boolean grid, where some entries are set to true, and another part that draws based on those locations. What if we were to redraw the underlying boolean grid and move those true entries by one spot to the left? Let's wrap the code that generates the grid in a function:
function redrawGrid(t){
  bools = [];
  for (x = padding; x < wx - padding; x += spacing) {
    row = [];
    for (y = padding; y < wy - padding; y += spacing) {
      row.push(0);
    }
    randomRowIndex = int(noise(x*0.01+t,y*0.01)*row.length);
    row[randomRowIndex] = 1;
    bools.push(row);
  }
}
The function also takes as input a variable t that stands for time (or basically any other parameter that increases over time), this variable will be fed into the noise function's first input. Now we simply need to call this redrawGrid() function at the bottom of the draw loop:
This is awesome, now we have an endlessly looping mini mountainscape!
Perfectly Looping Canyon
The last thing I wanted to tackle, is making a perfectly loopable mountainscape. We can do so to some extent we can loop the horizontally scrolling slice by periodically resetting the increasing parameter fed to the noise function:
randomRowIndex = int(
  noise(((x + t * 100) % (wx - padding)) * 0.01, y * 0.01) * row.length
);
This little hack is doing a lot, and might be sufficient if you want to export a perfect loop. You would just have to rerun the sketch a couple of times until the break off point is seamless. In other scenarios that one cut-off ridge might be very prominent:
If you're someone like me, the previous solution will not satisfy you. Below is the code for a version, where the loop is seamless every time. Here, we're treating the grid drawn to the canvas as a sliding window that moves over a looping, much wider grid! This wider grid is determined before anything gets drawn to the screen, and the column indexes of the true entries are stored in an array called 'noiseArray'.
How do we ensure that this noiseArray loops back around? After generating a number of column indexes that is larger than the number of columns currently shown on canvas, we check if we encounter a column index that matches up with the first entry in the array. The smoothness properties of the perlin noise we're using should ensure that this is a smooth transition.
The fascinating thing about making a GIF from this is that takes the viewer quite a while to figure out if the GIF is a perfect loop or not, and probably has to make a mental note of some landmark to see if it comes around again. The code goes here:
Nevermind the debug information in the corner. I essentially shows the index of the first entry, the last, the length of the noise array as well as the current position. The red circle appears when it loops back around. Messing a little with the code, this can also lead to some interesting results as follows:
And that's pretty much a wrap. Simple sketch, with lots of interesting concepts under the hood. If this tutorial sparks any inspiration and you end making some sketch inspired by this, please @ me on Twitter (@gorillasu). Otherwise, if you enjoyed this post share it with a friend, it helps out a bunch! That's it, cheers, see you in the next one! 😊