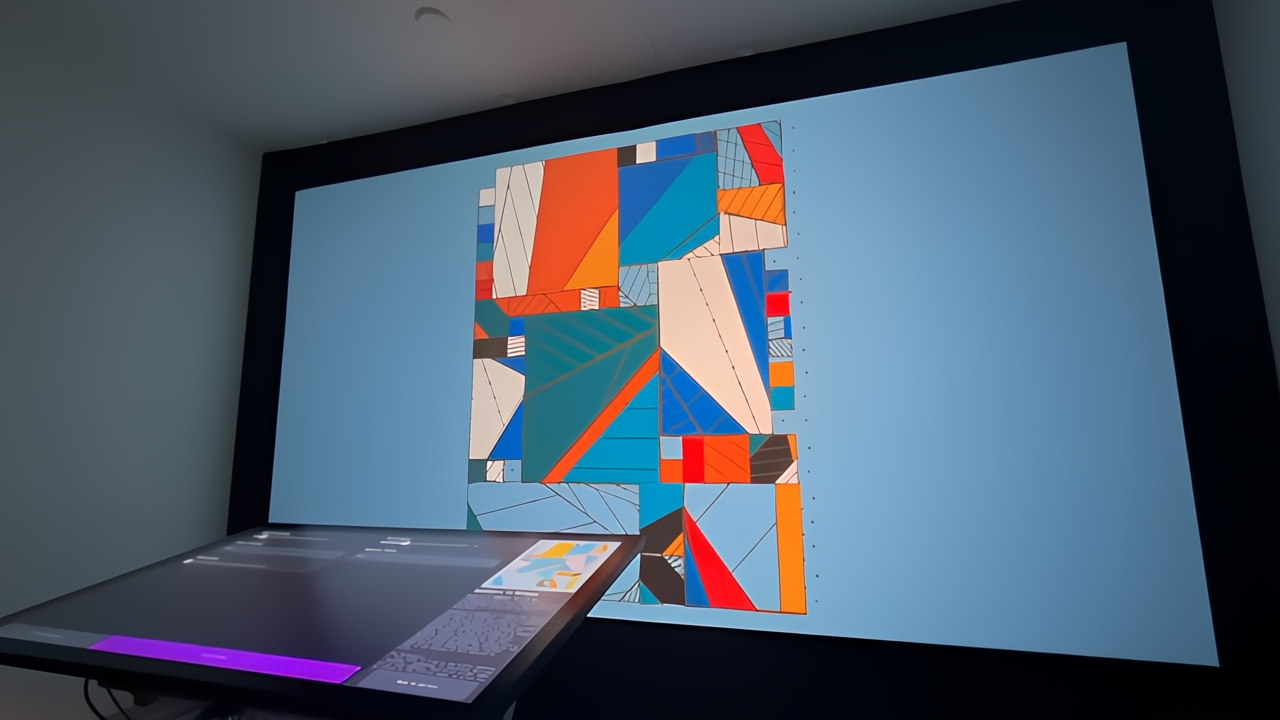
In this article I'll give you a peek behind the scenes for my generative token Somewhere in Between, from initial ideas and inspirations and to the complete project that lives on FxHash now. Somewhere in Between was minting as a part of the live minting event Blockchain as a new Medium for Art at The Face in Daikanyama, Tokyo. A collaboration between FxHas, Kumaleon and Proof of X.
The live minting setup at The Face in Daikanyama
Initial Inspirations
You've most likely already seen some tweets about it over on the bird site - and at this point probably want me to shut up about it - but I'm really proud of how the project ultimately turned out in the end!
It's the first time that I have a piece somewhere out there in the real world on a huge screen, it's by far my biggest W this year - so far!

Early May I saw this announcement on FxHash's discord about a collaboration with Kumaleon. Kumaleon had reached out some months prior about an opportunity on ETH, but at the time I had to decline, since the chain was still proof of work. I didn't want to pass on this one however - hence I quickly filled out the form and sent it on it's merry way.
Come early April and I got mentioned in a tweet by Proof of X that I was on the roster of participating artists. I didn't waste much time and pretty much got started instantly on some ideas for a sketch - I got out my sketchbook and quickly put down some rectangular scribbles.
Irregular Grids
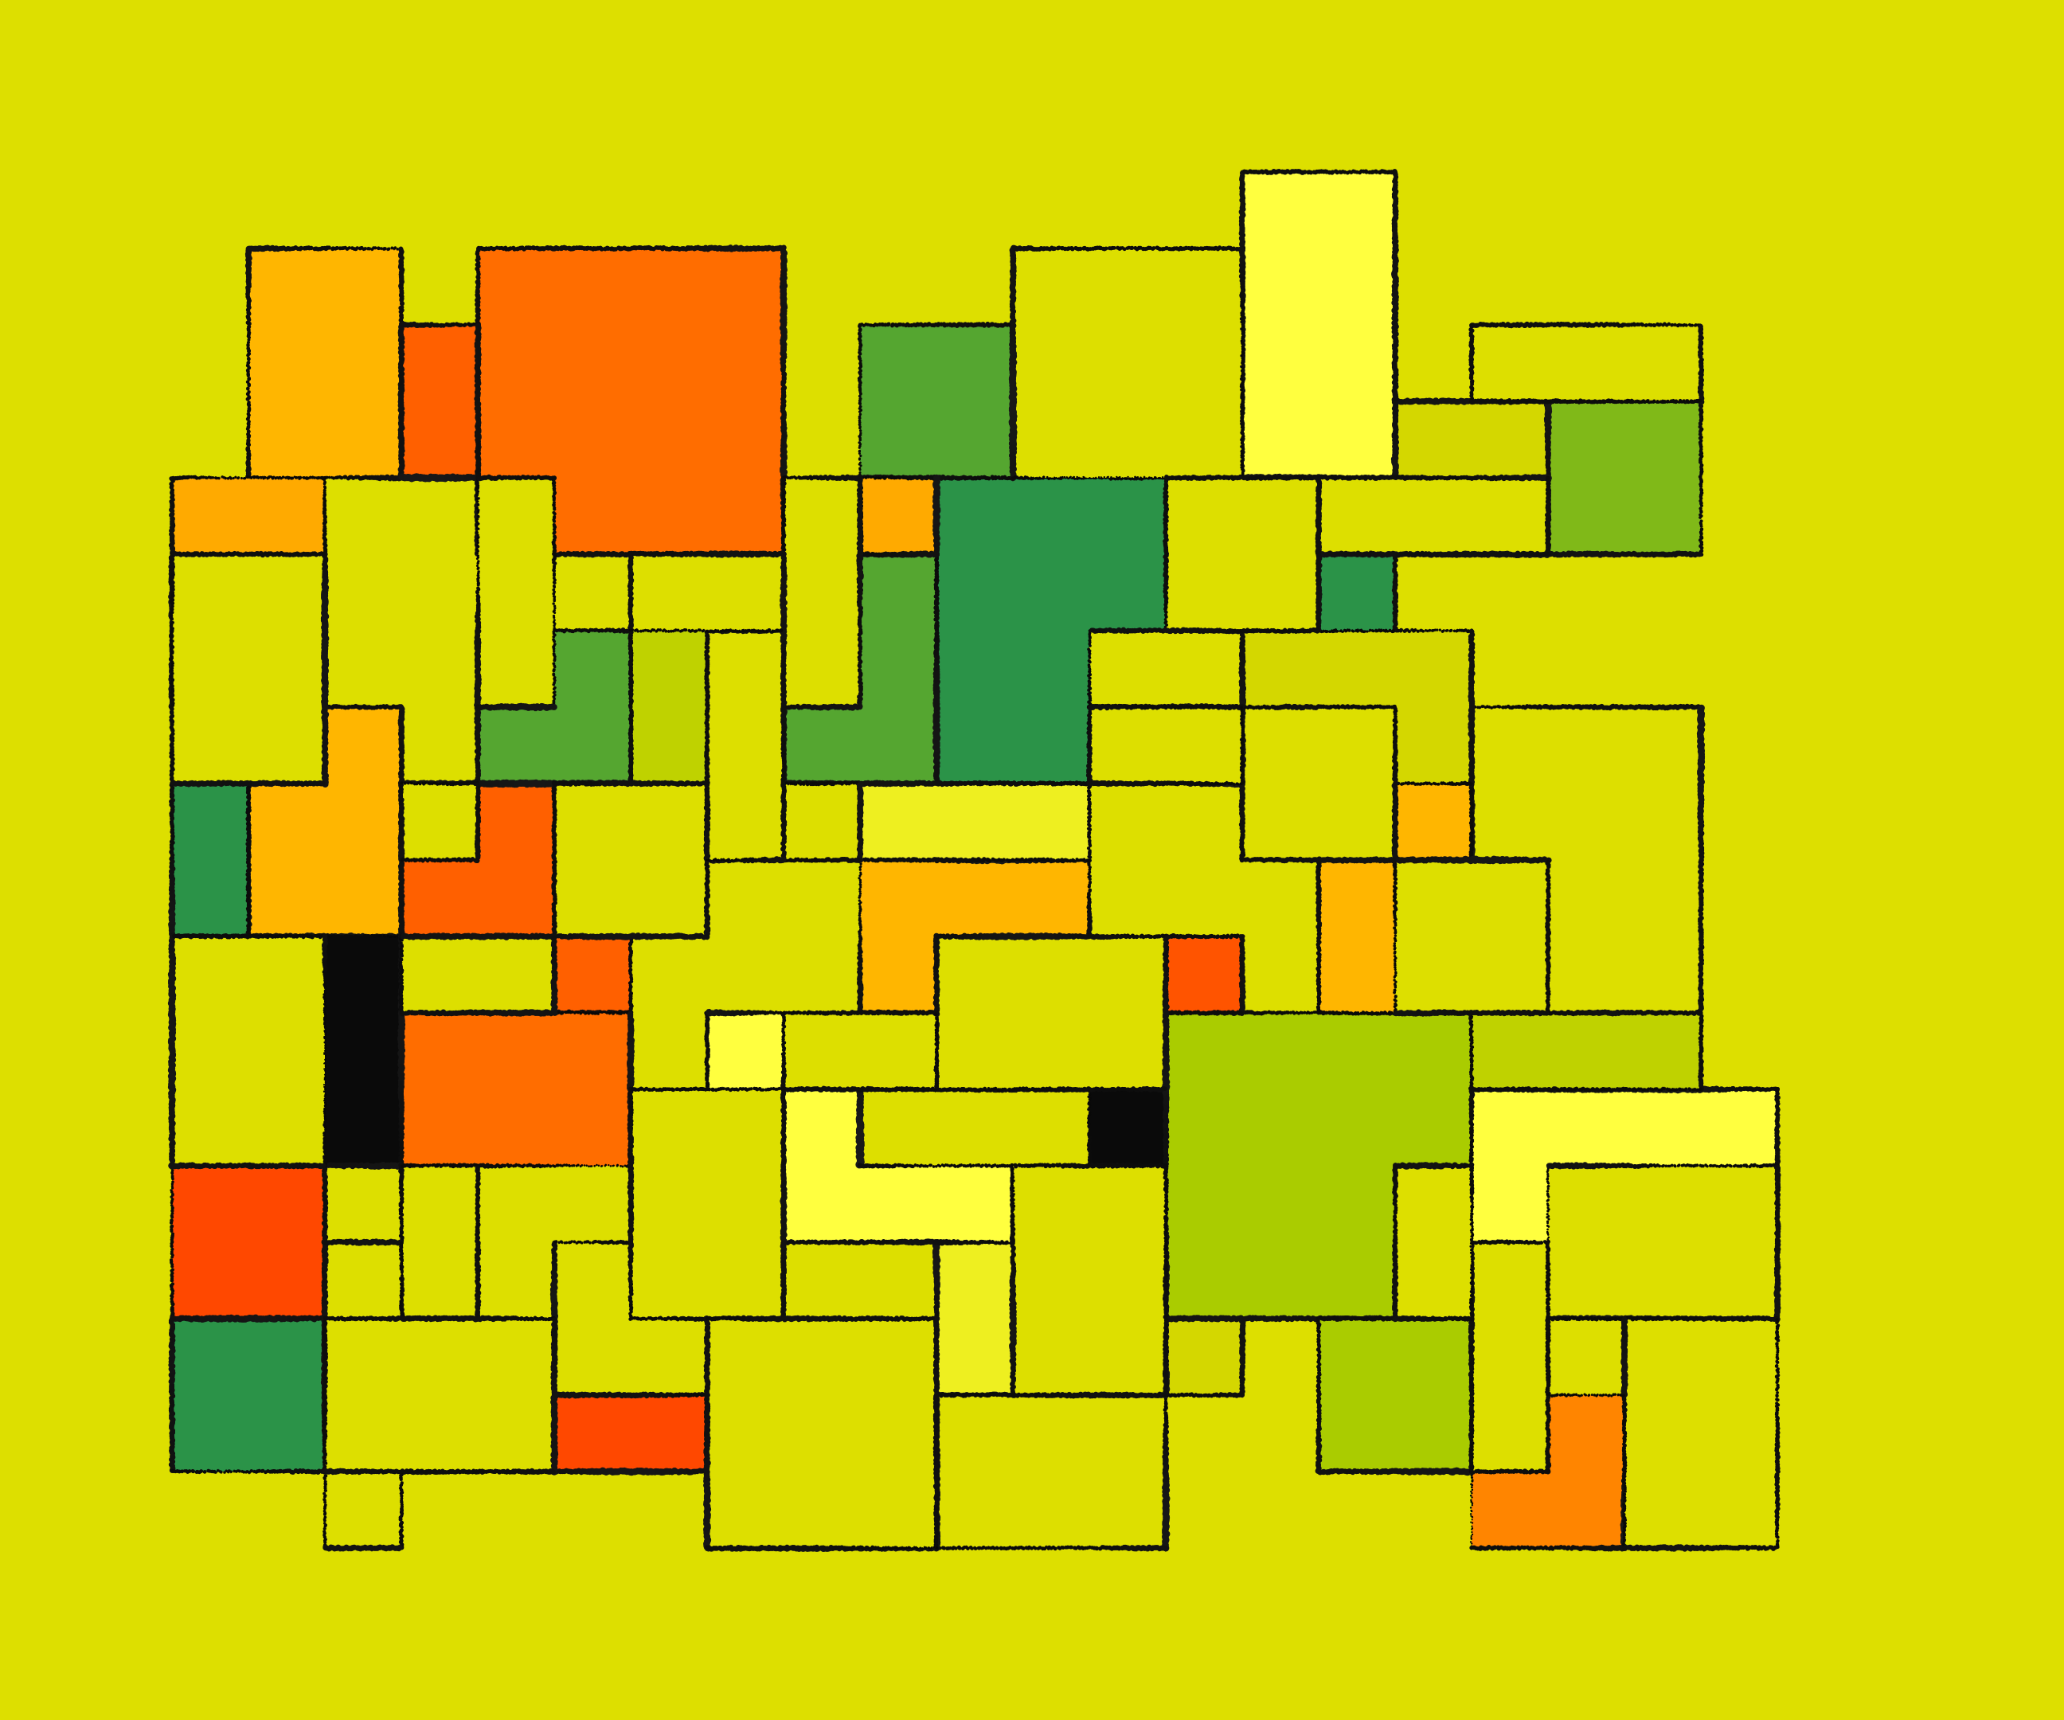
For some reason, after I came up with my irregular grid strategy in 2021, I never really ended up using it that much in my sketches:
A familiar starting point. It's essentially a rectangle packing algorithm, that doesn't actually need to compute collisions. Well not in an algebraic manner at least.
Even though it is a cornucopia of different grid patterns, simply by tweaking the input parameters, I never got around to using it that much. For this project however I had decided that it would be the foundation upon which I would build the rest of the sketch.
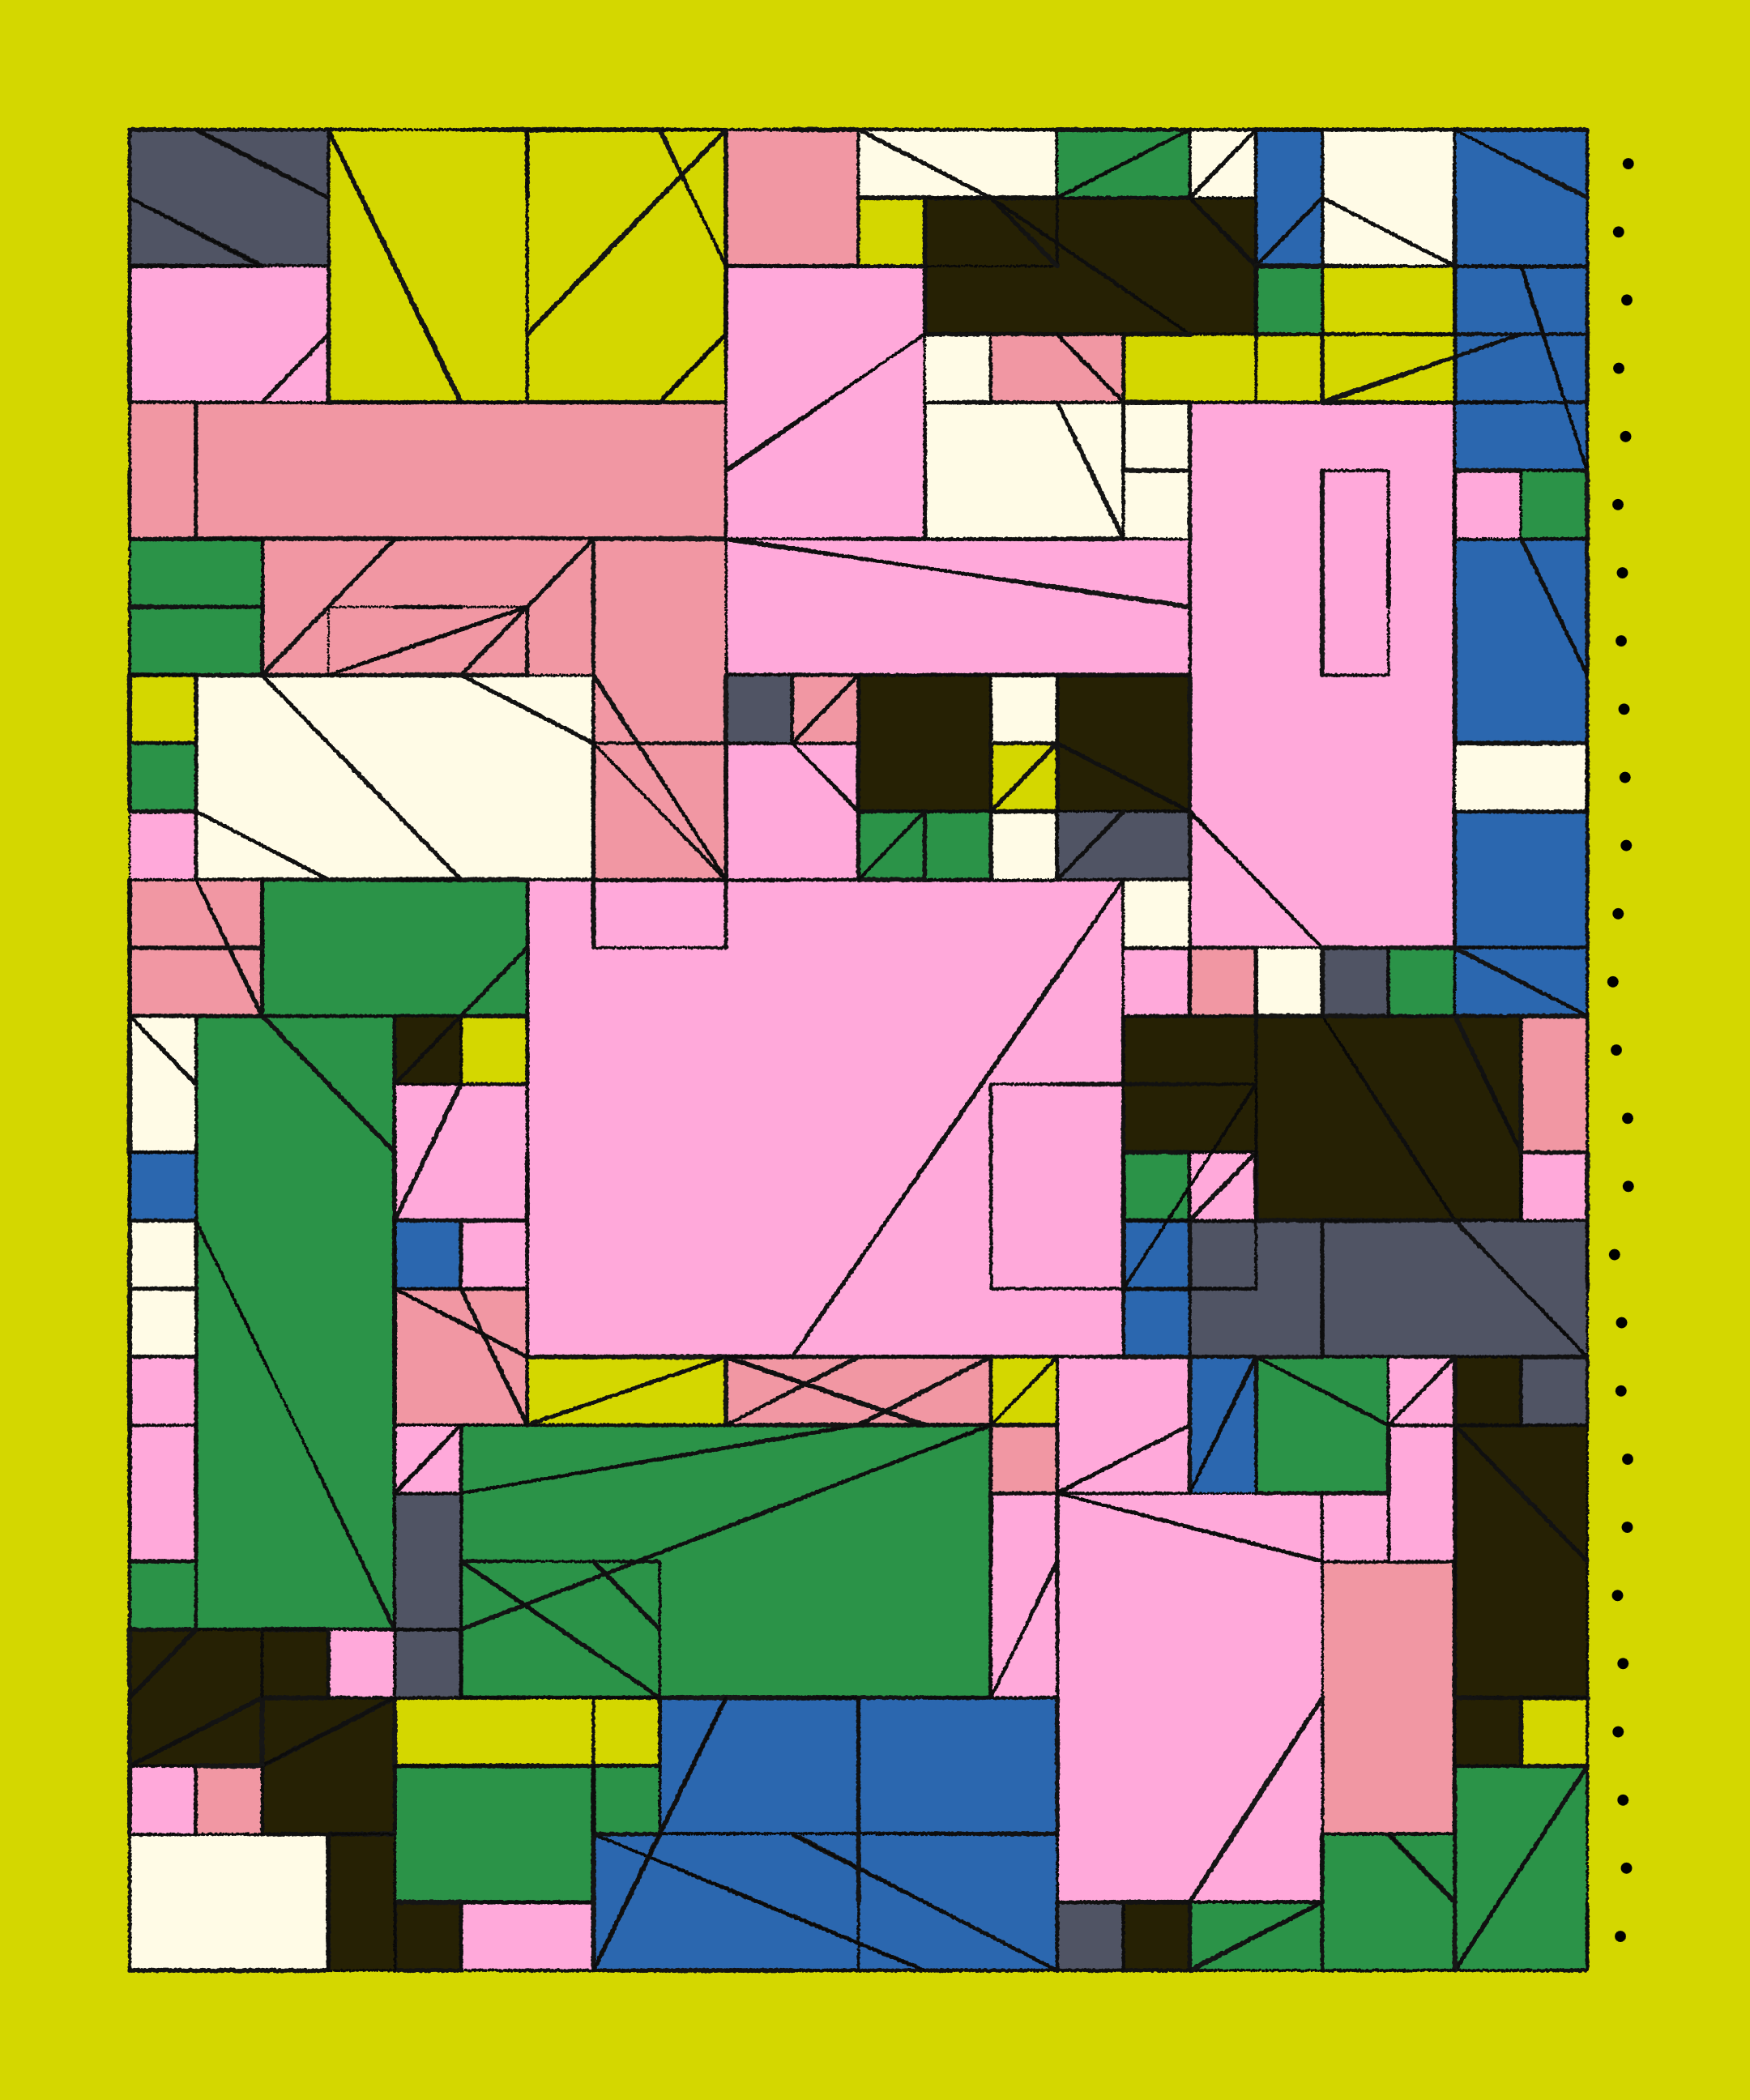
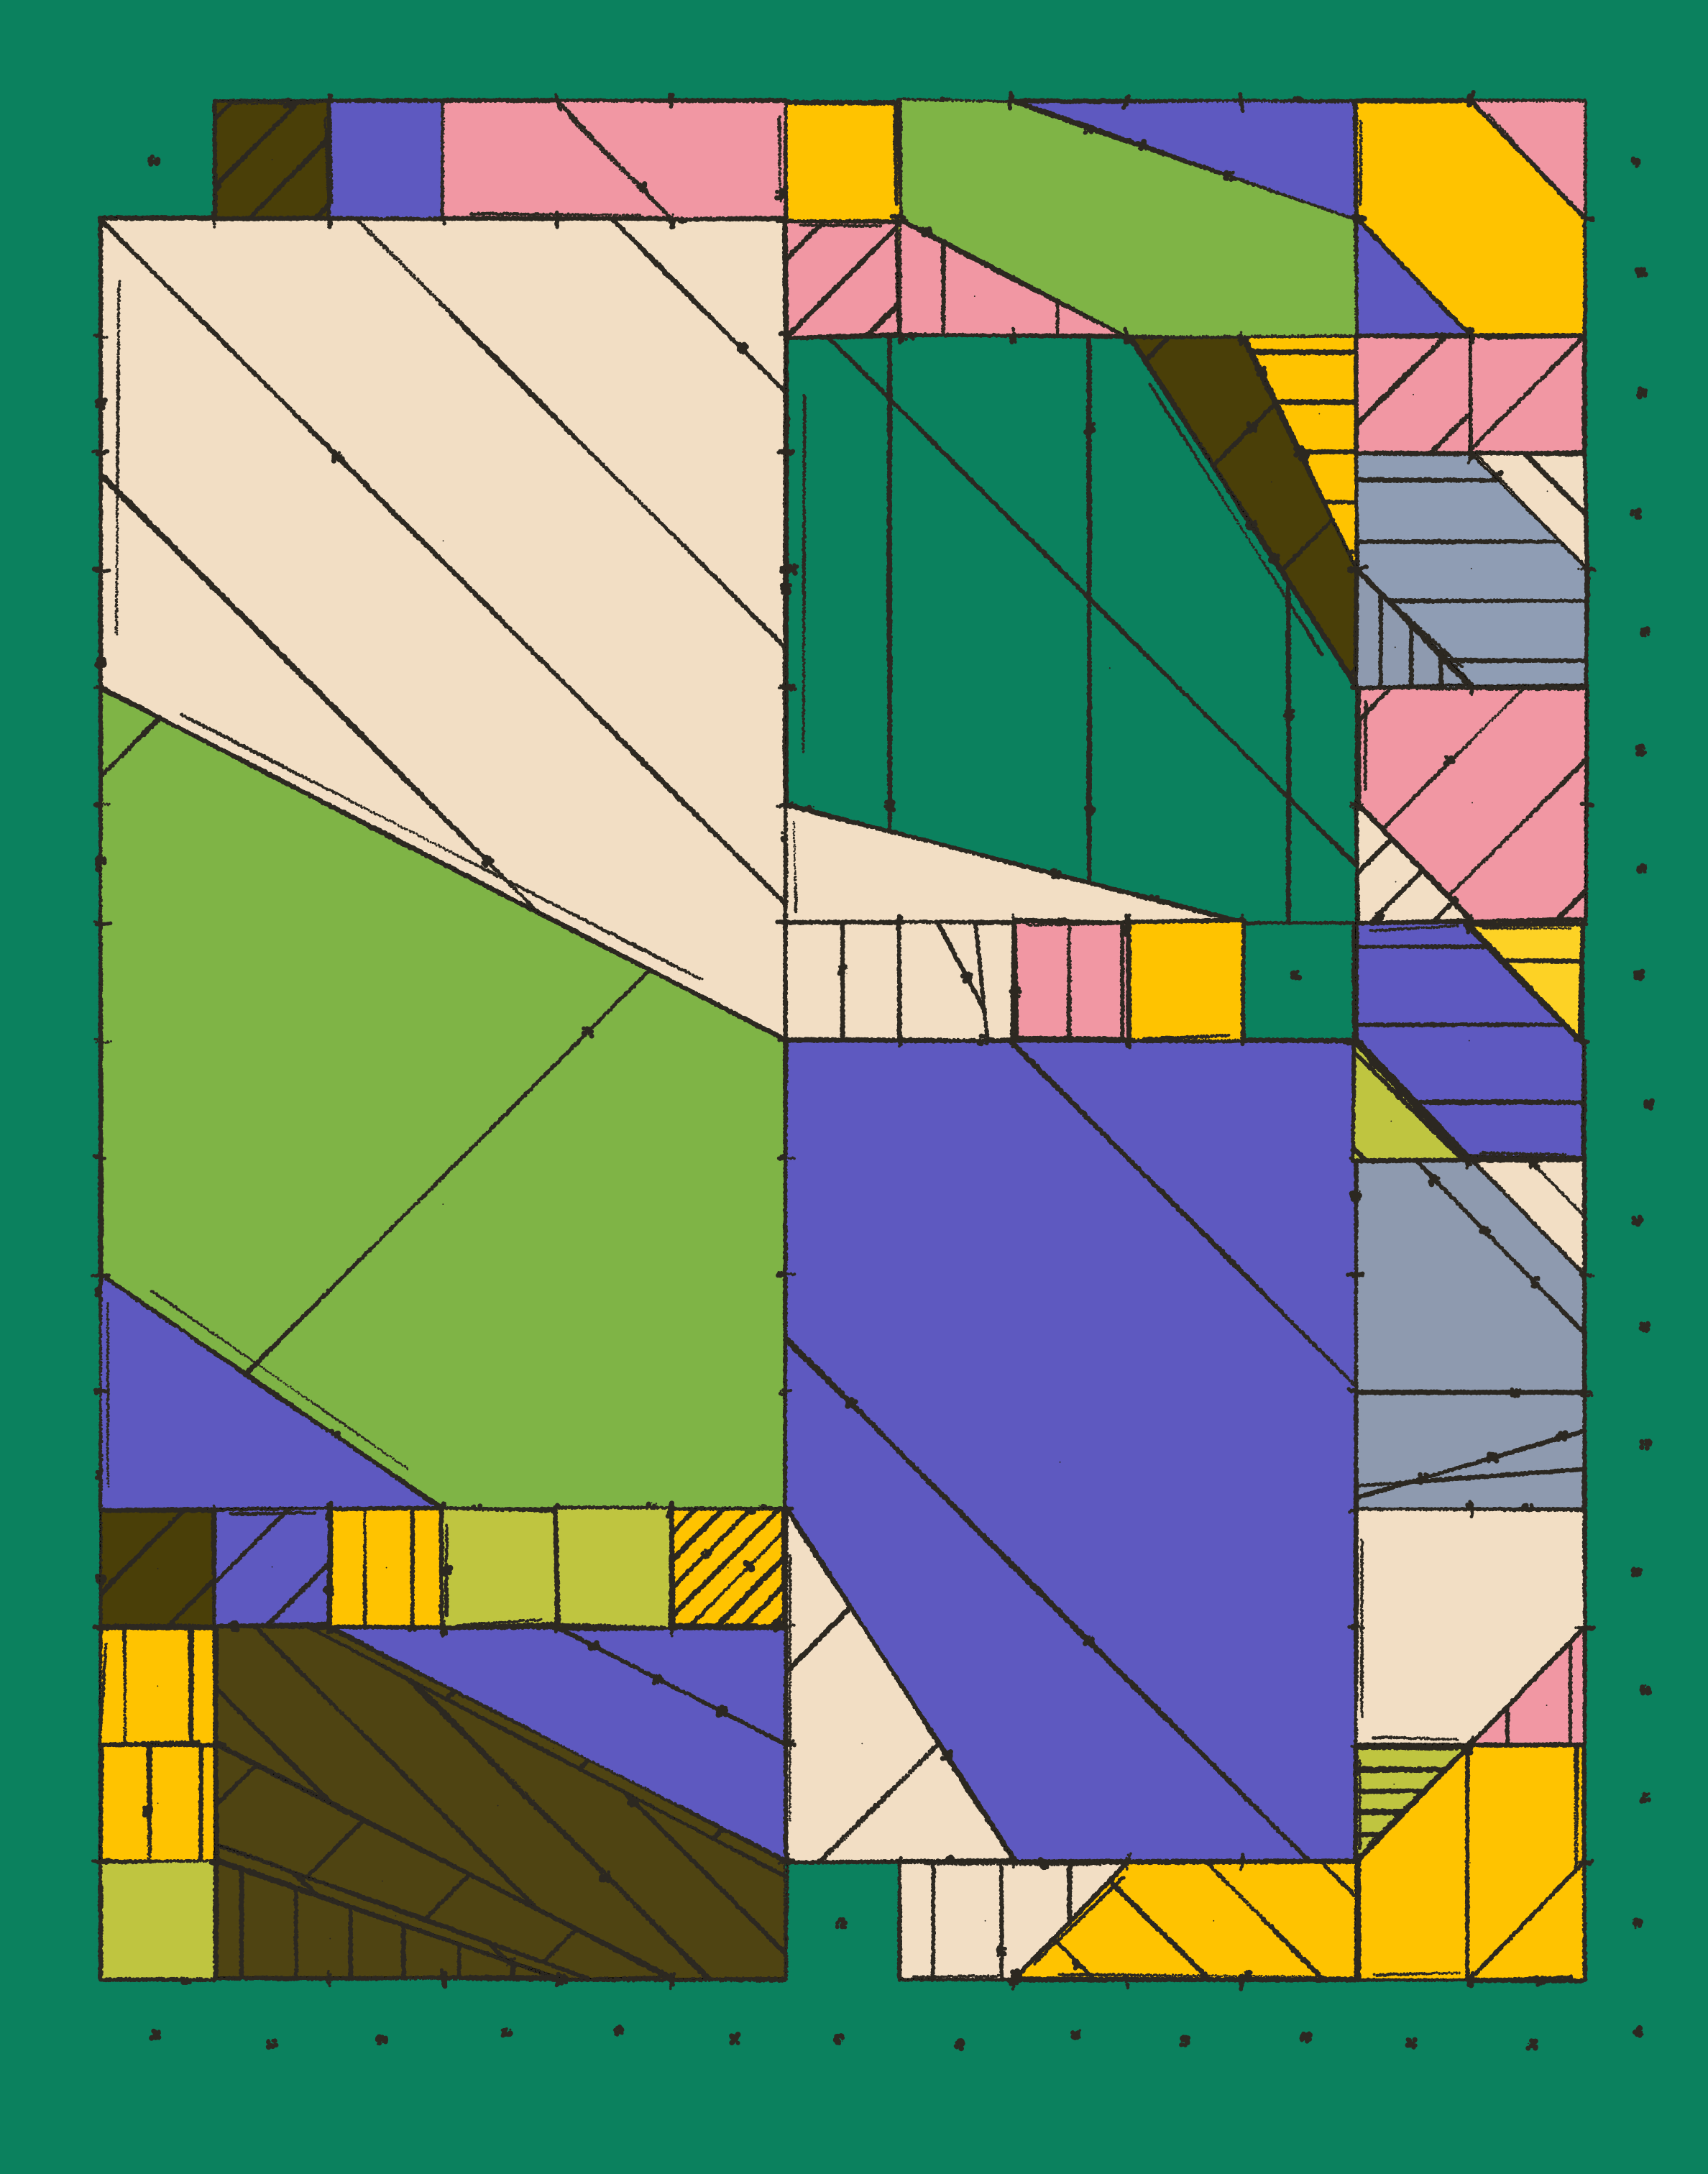
And it already felt like I've got something going there:
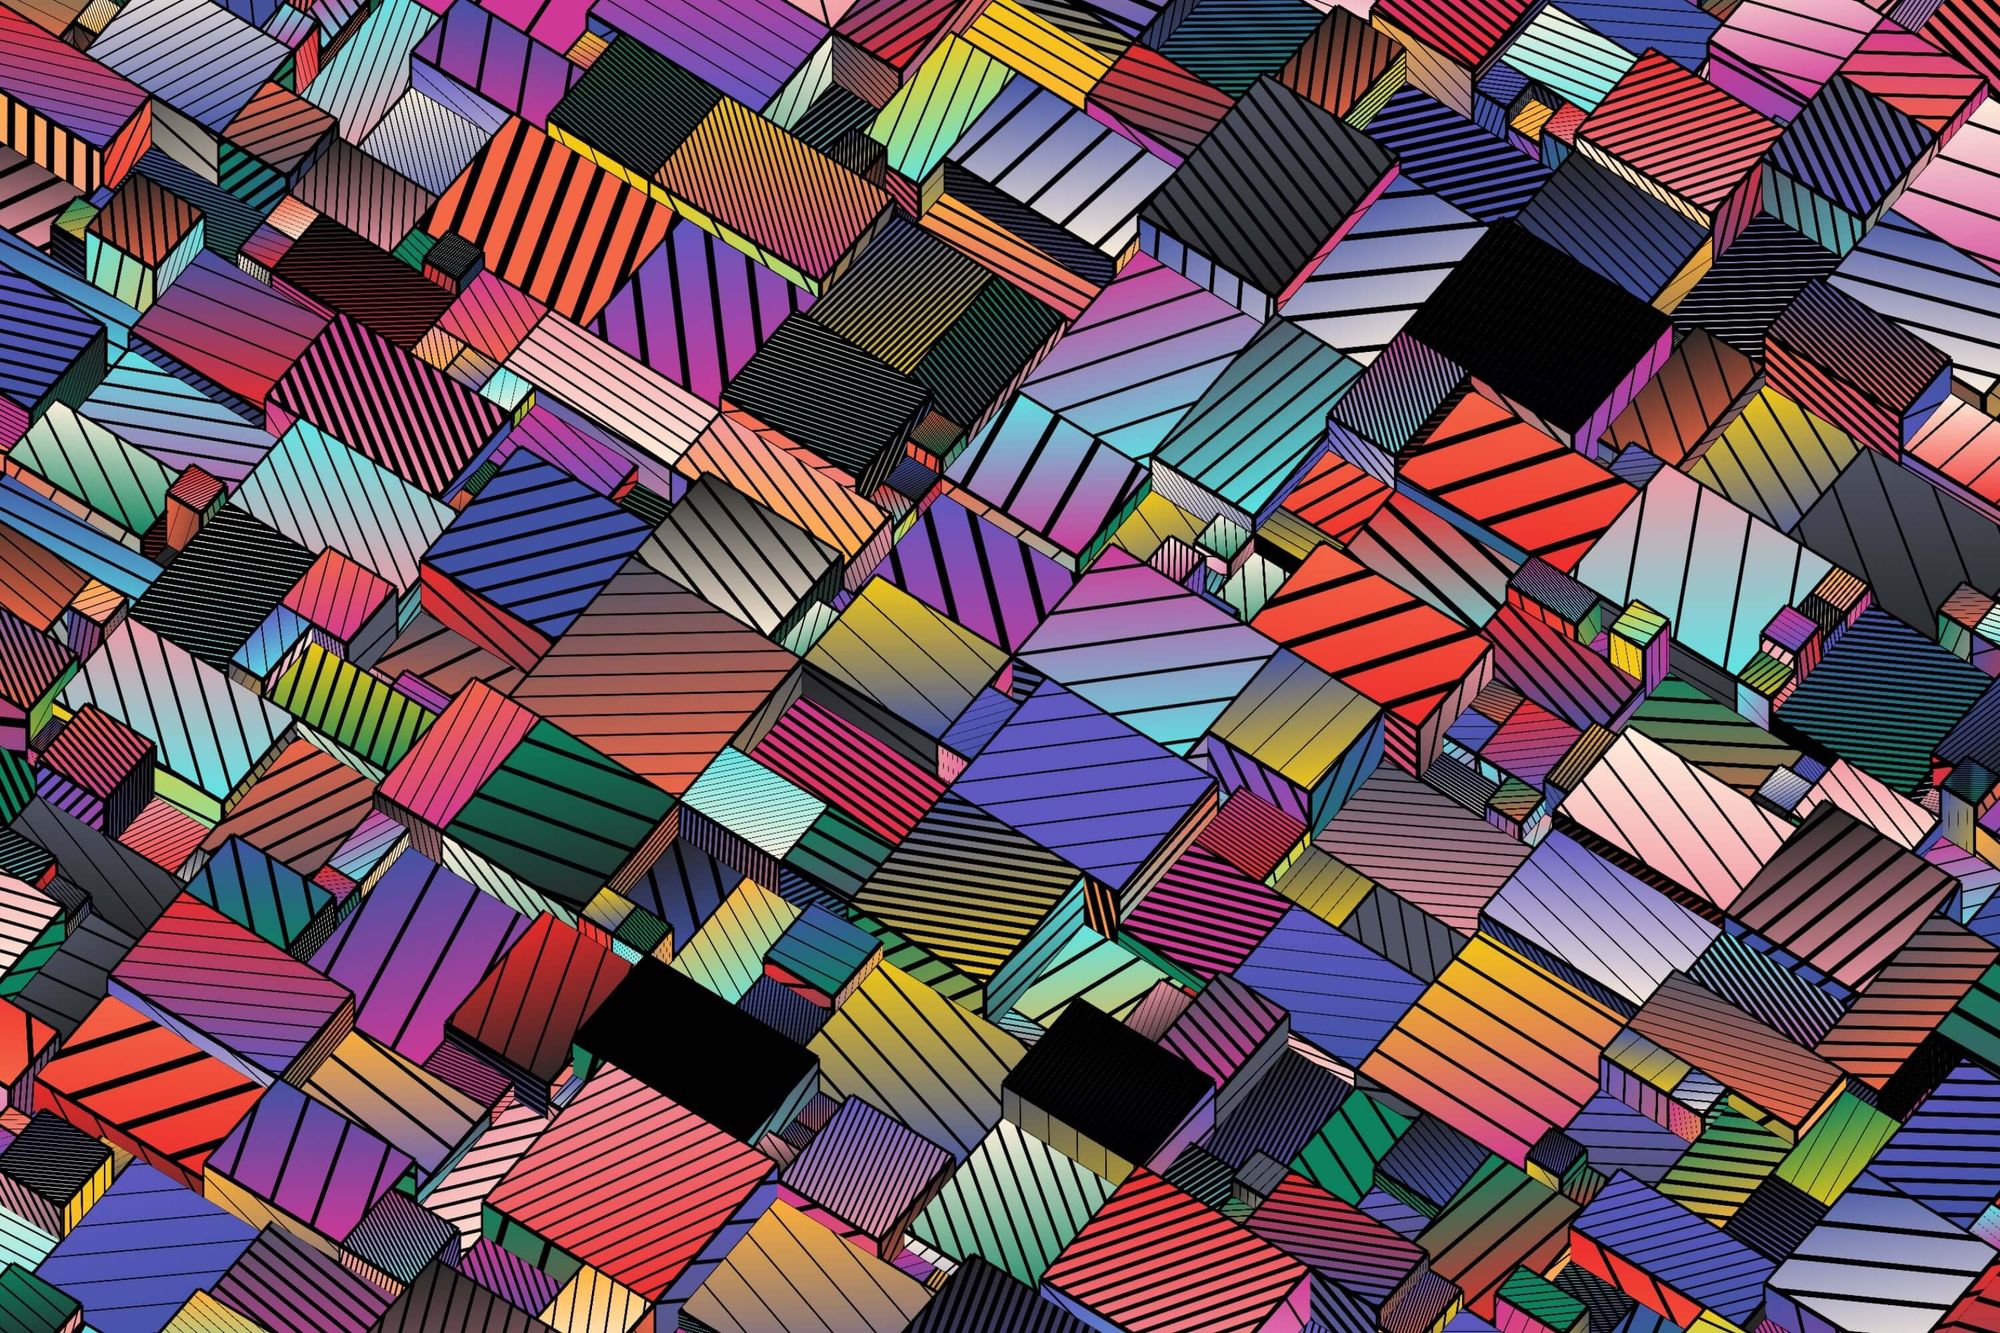
In the past months I even rehashed the entire algo to produce even more intricate patterns, with shapes that aren't necessarily rectangles, but still block-y in nature.
I don't want to share too much about it yet at this point because I want to experiment with it a bit more before I share the idea behind it, but it's growing to be one of the favorite things that I've ever made.
A creative solution to slicing Rectangles
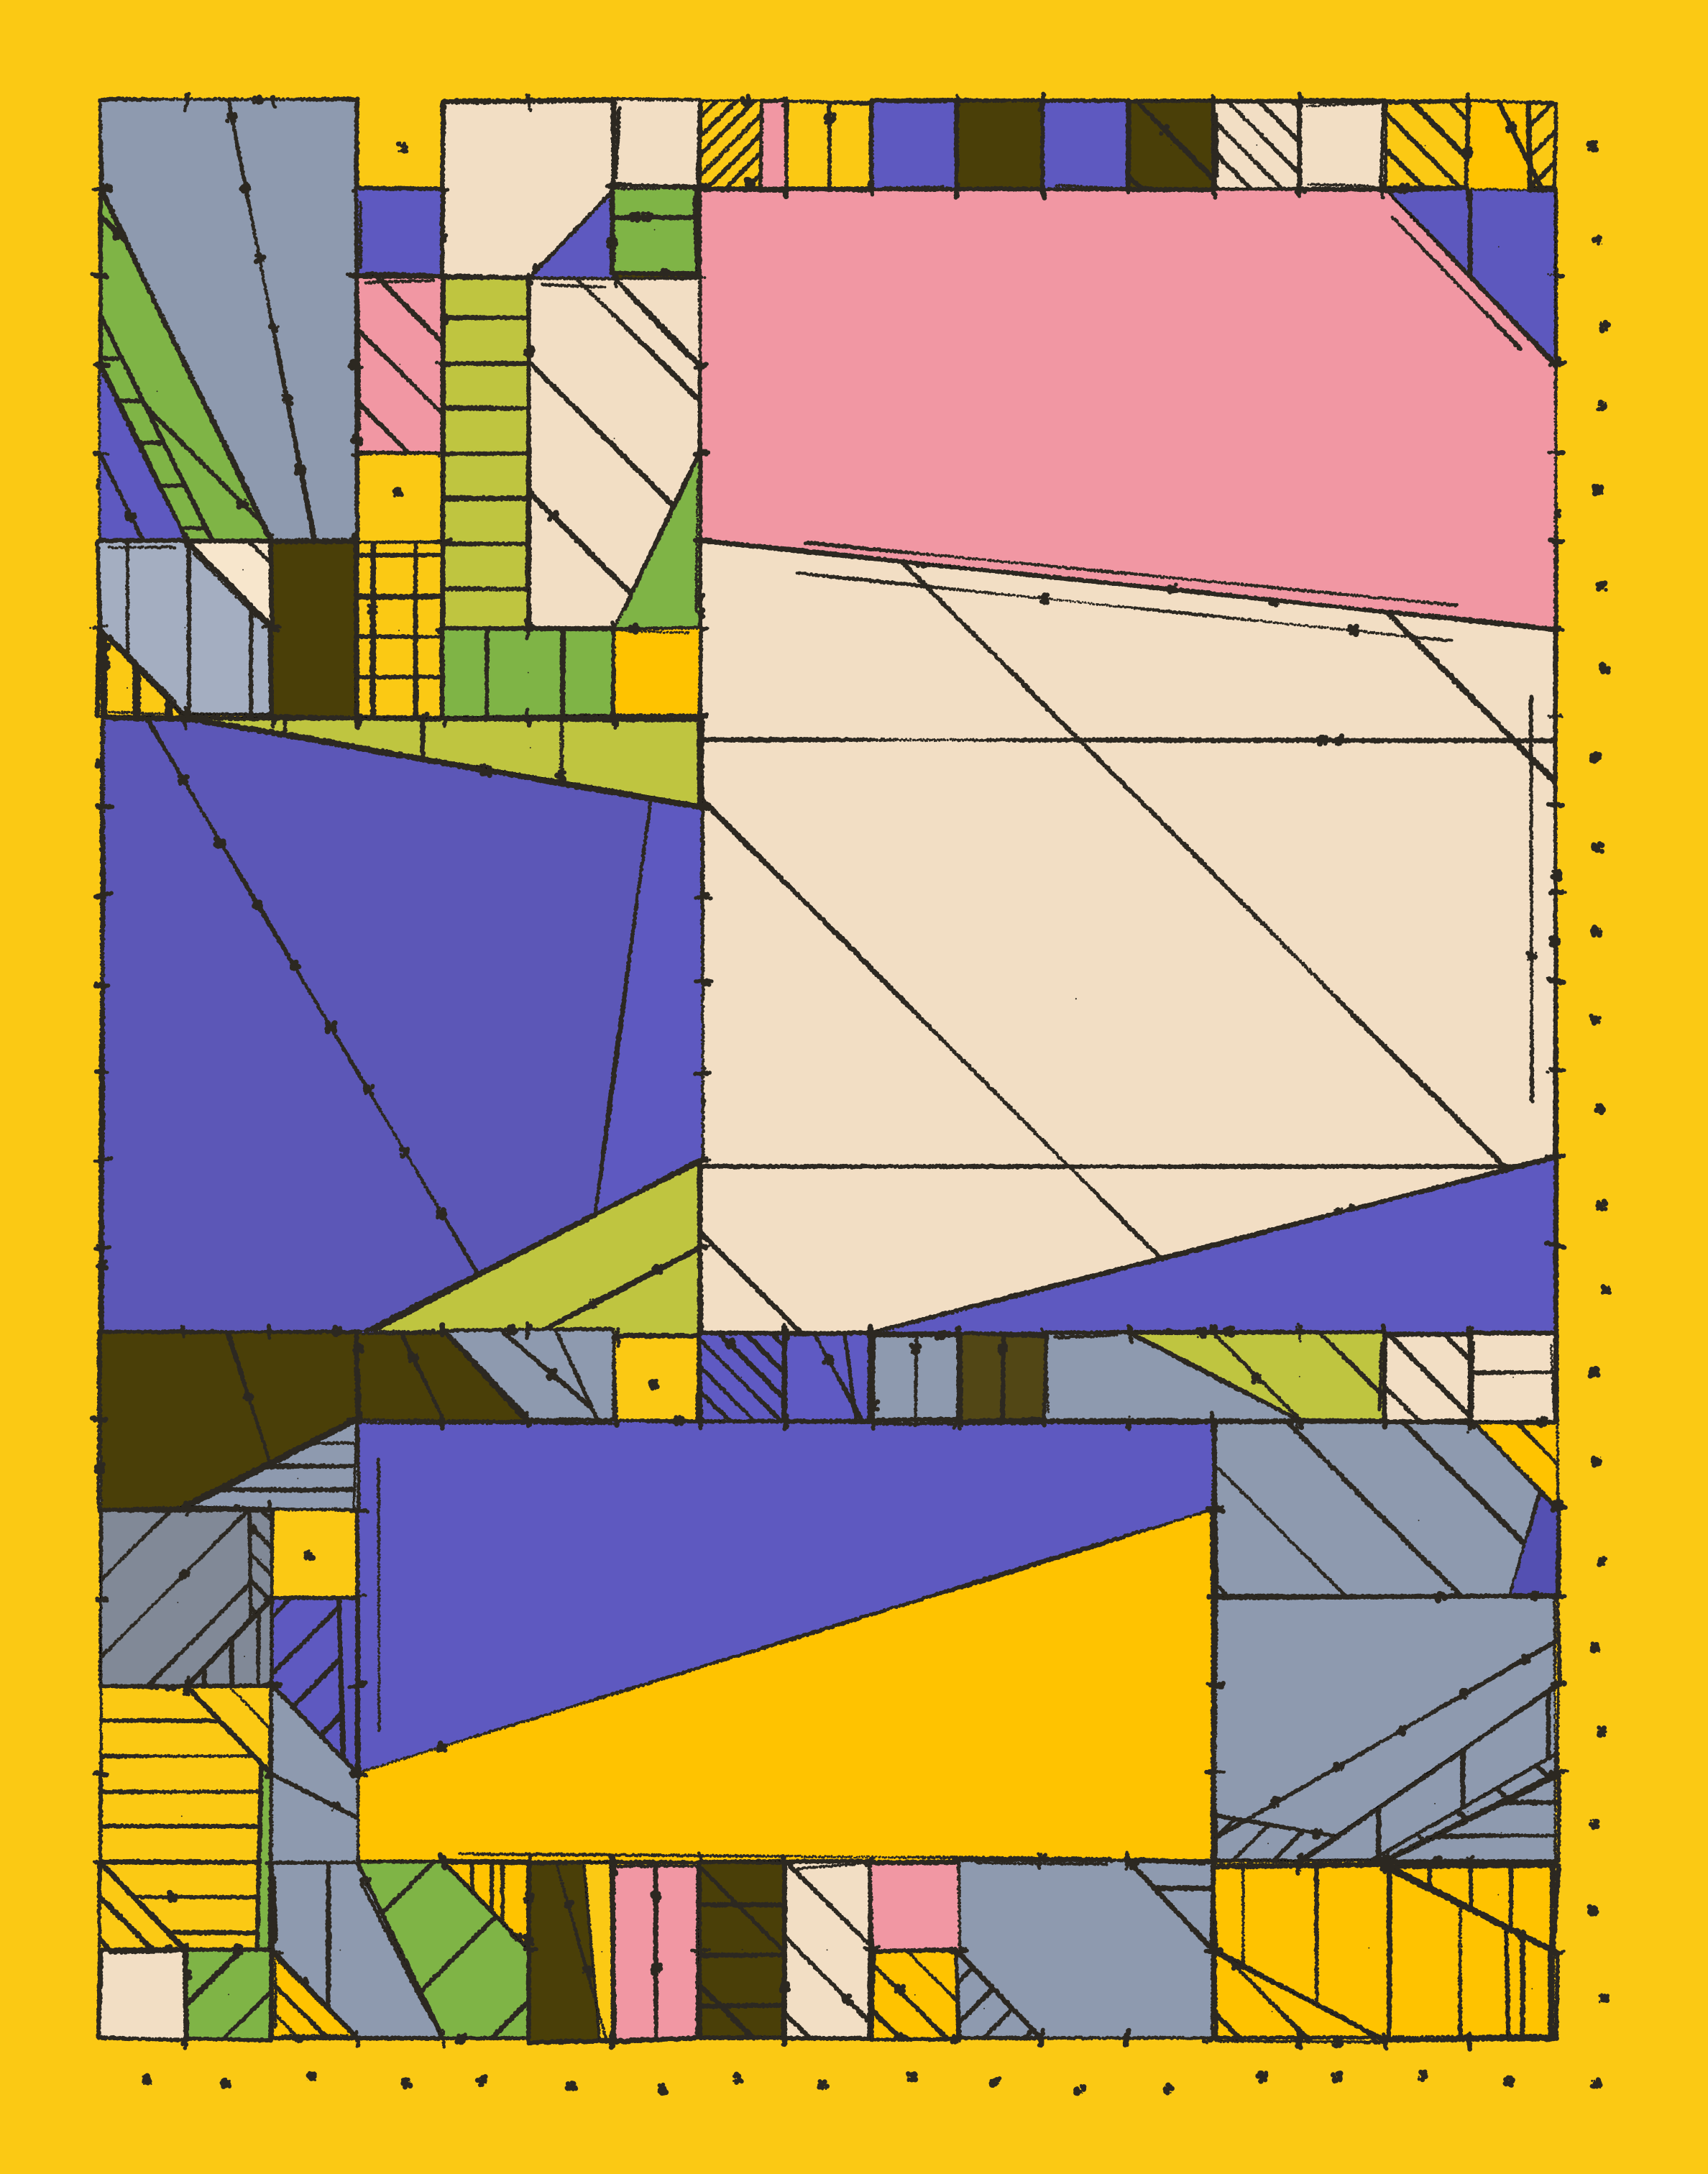
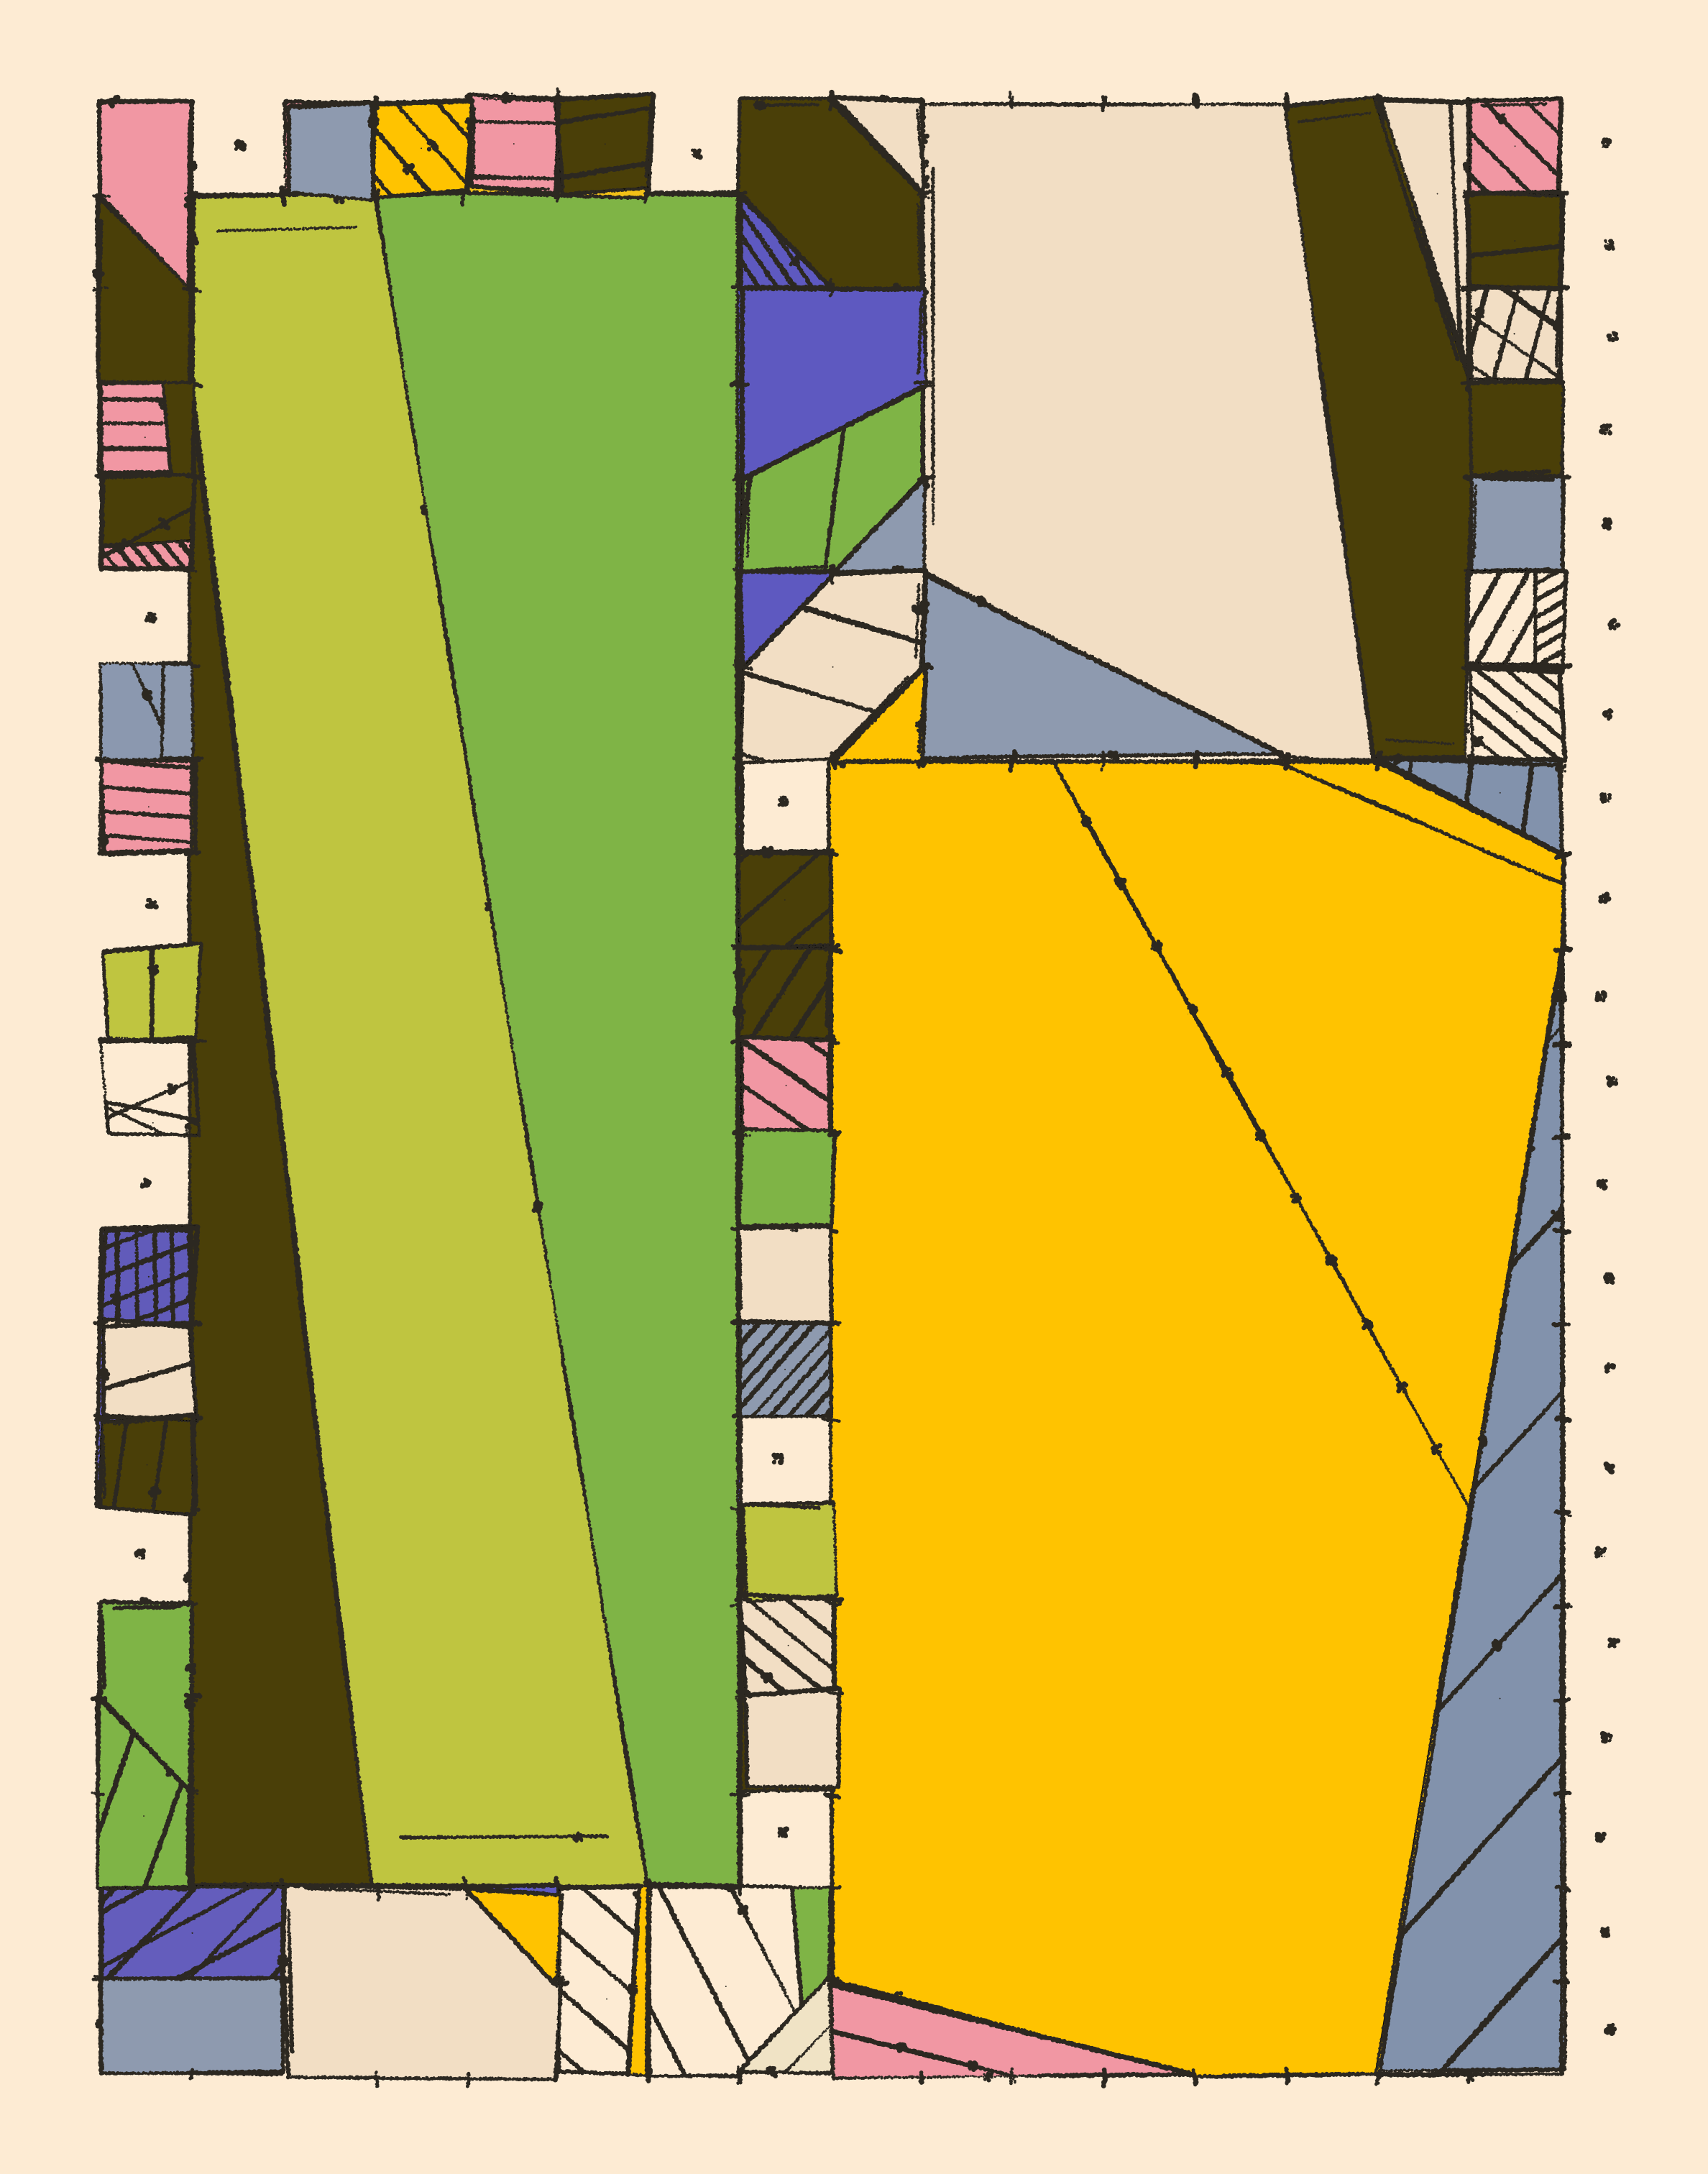
There's many ways to split rectangles into smaller polygons, but I wanted to do it in a different and new way, and that had a 'generative' component at it's core.
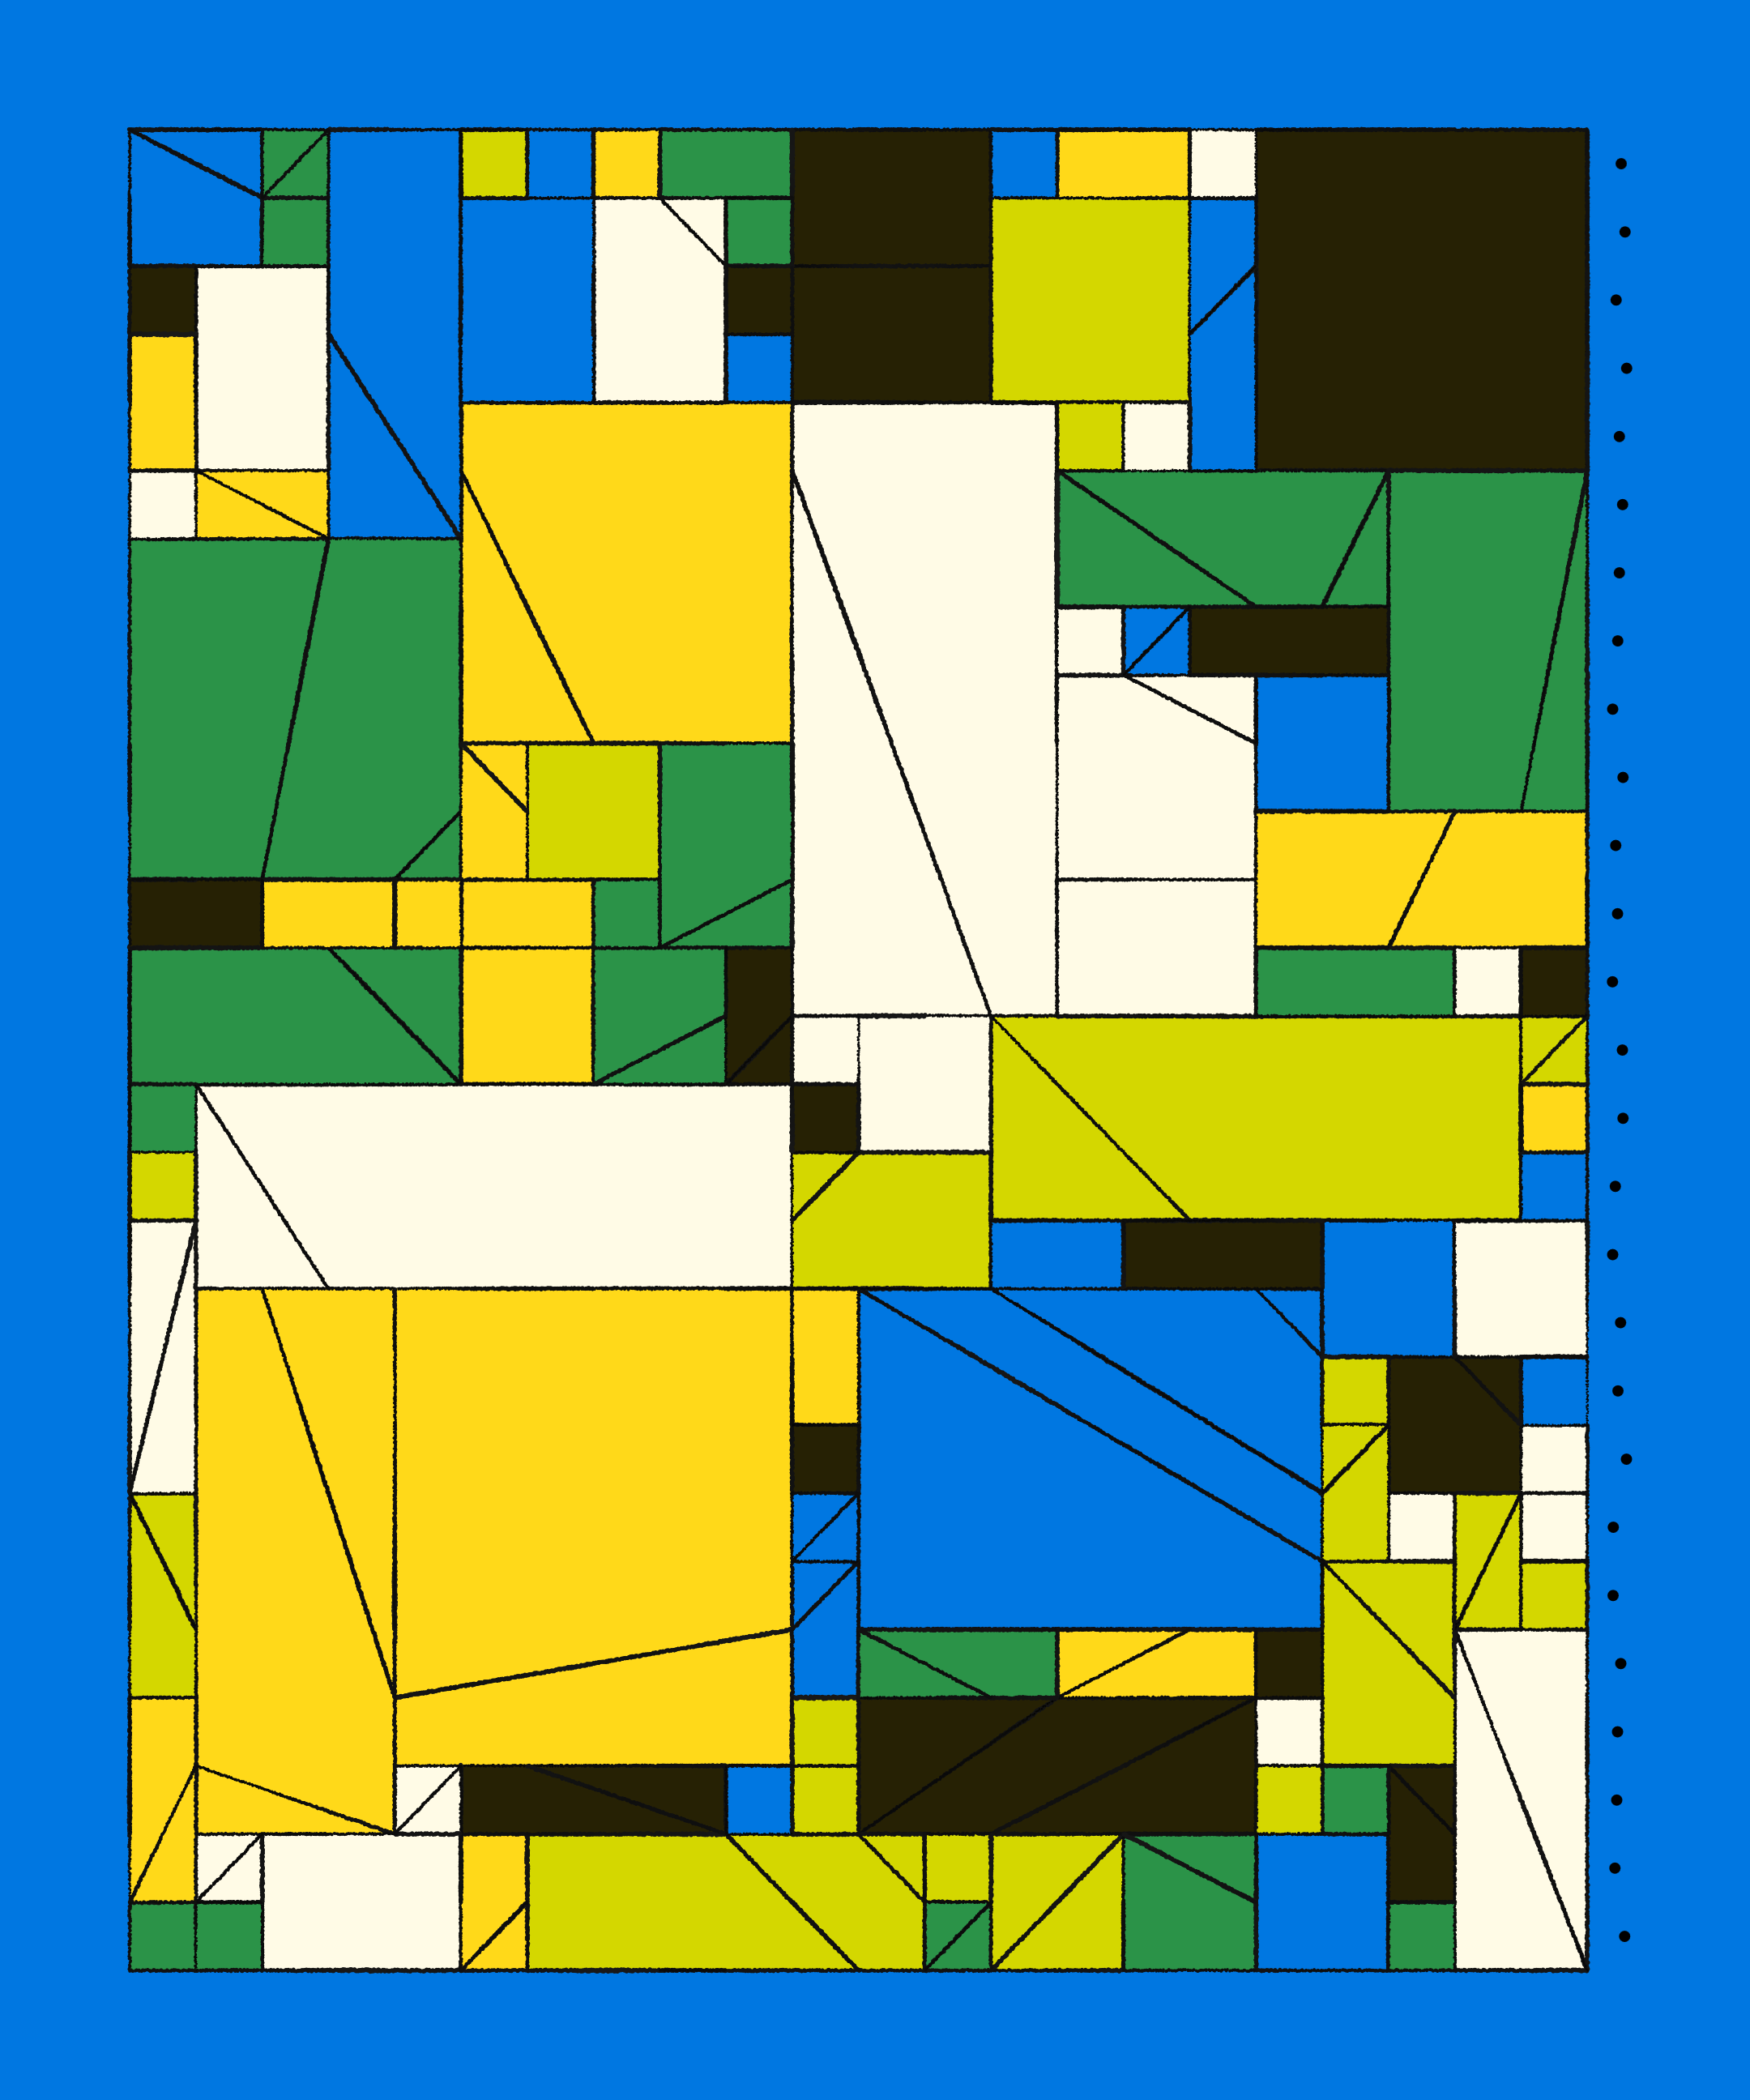
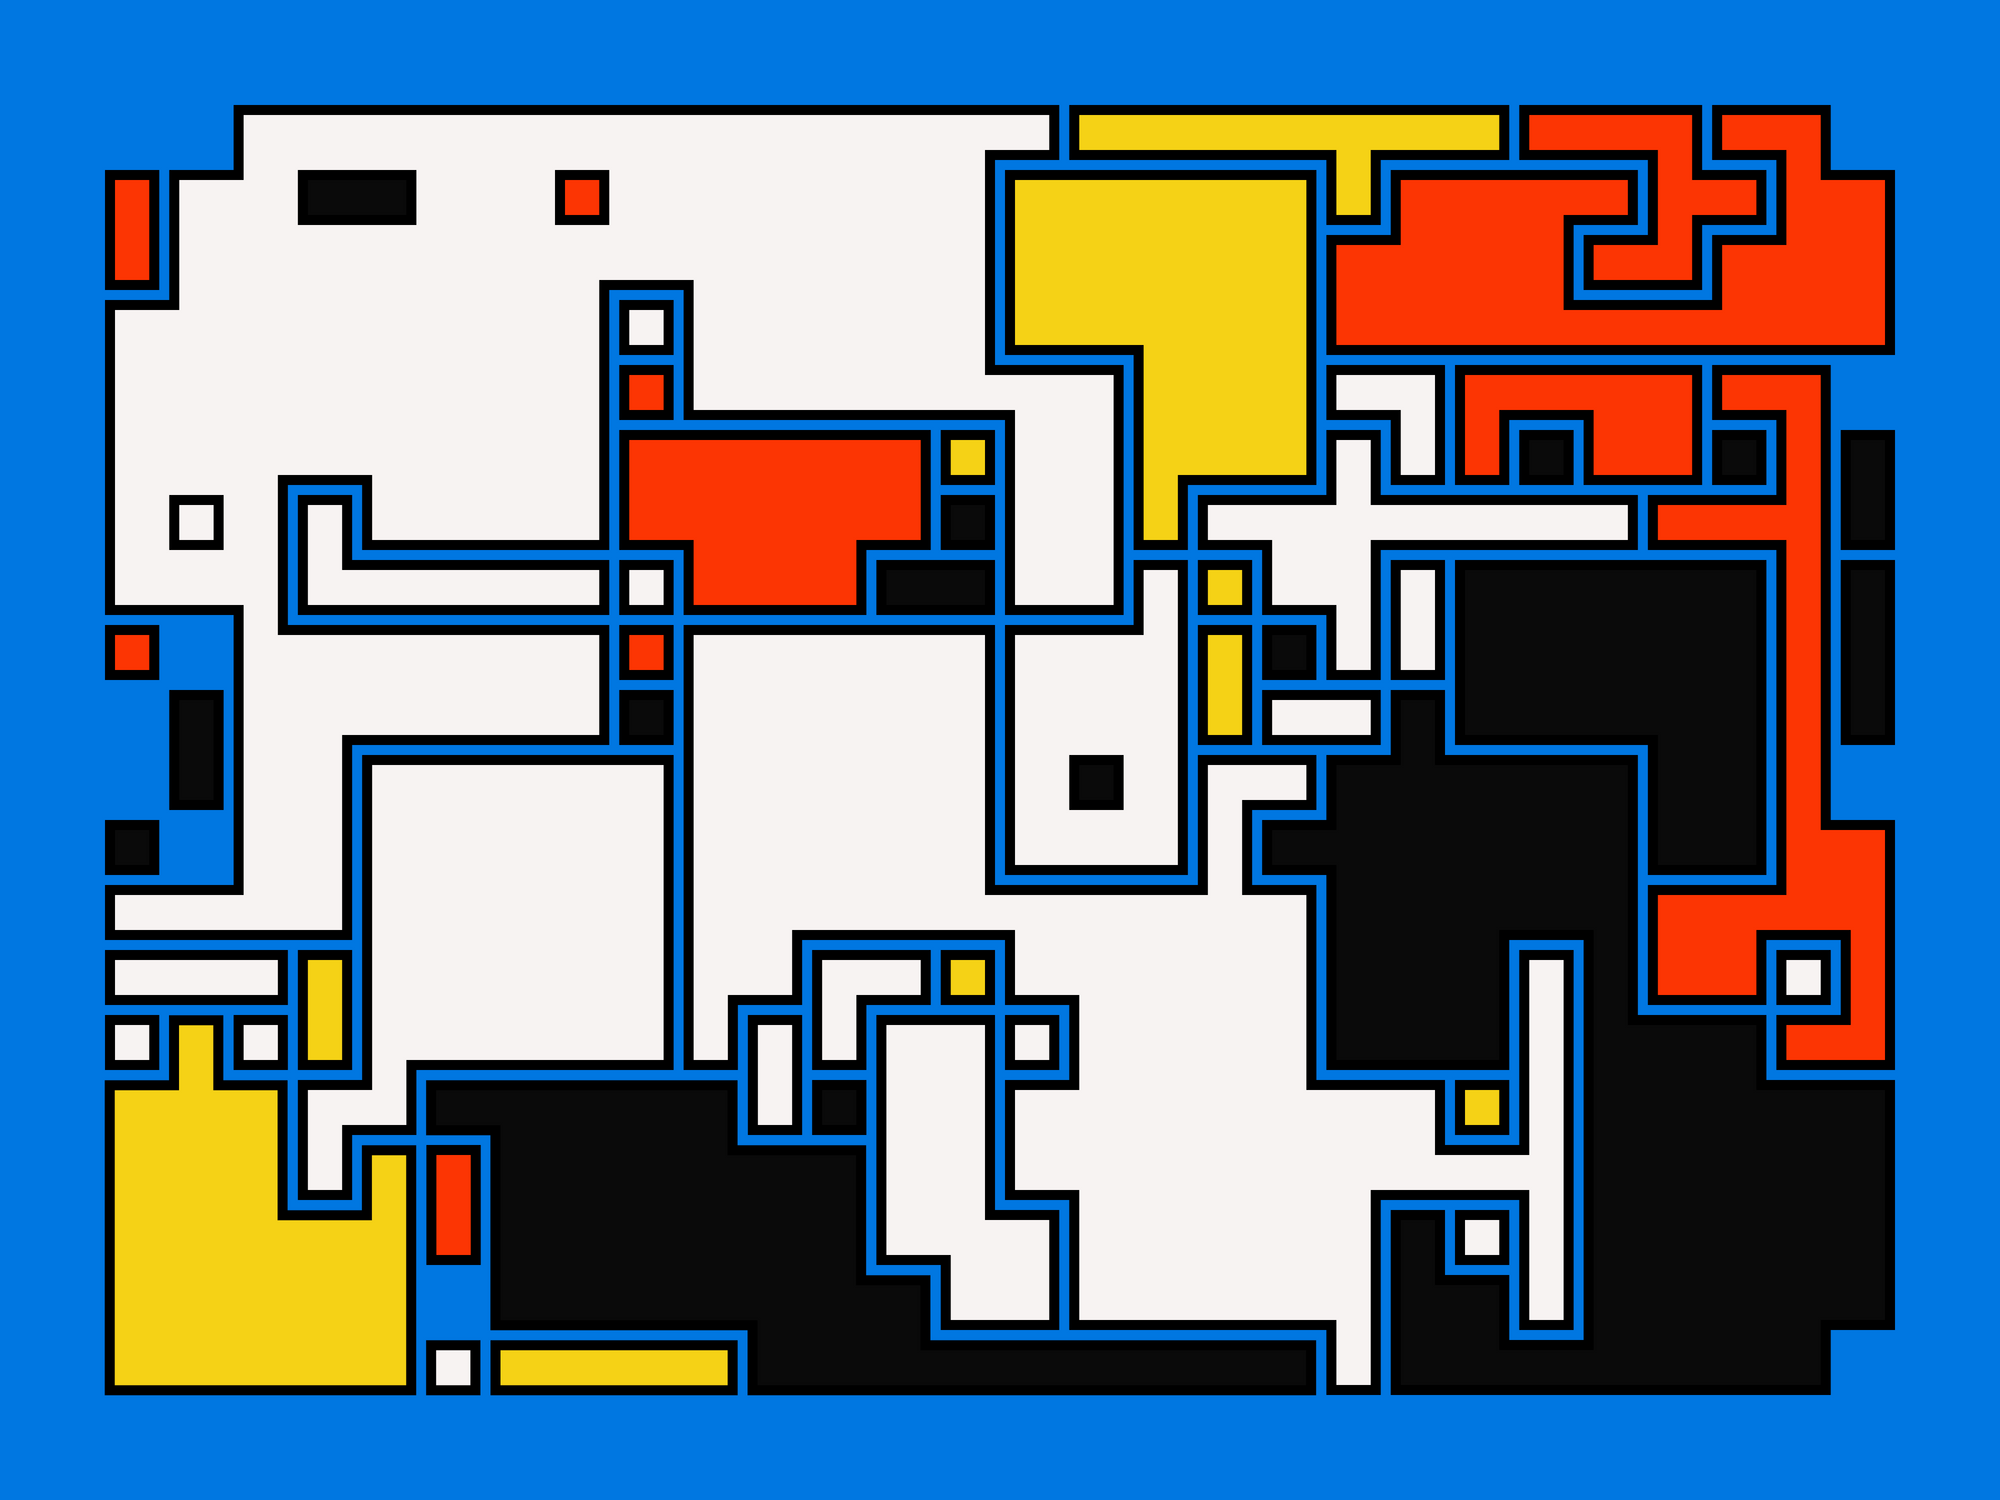
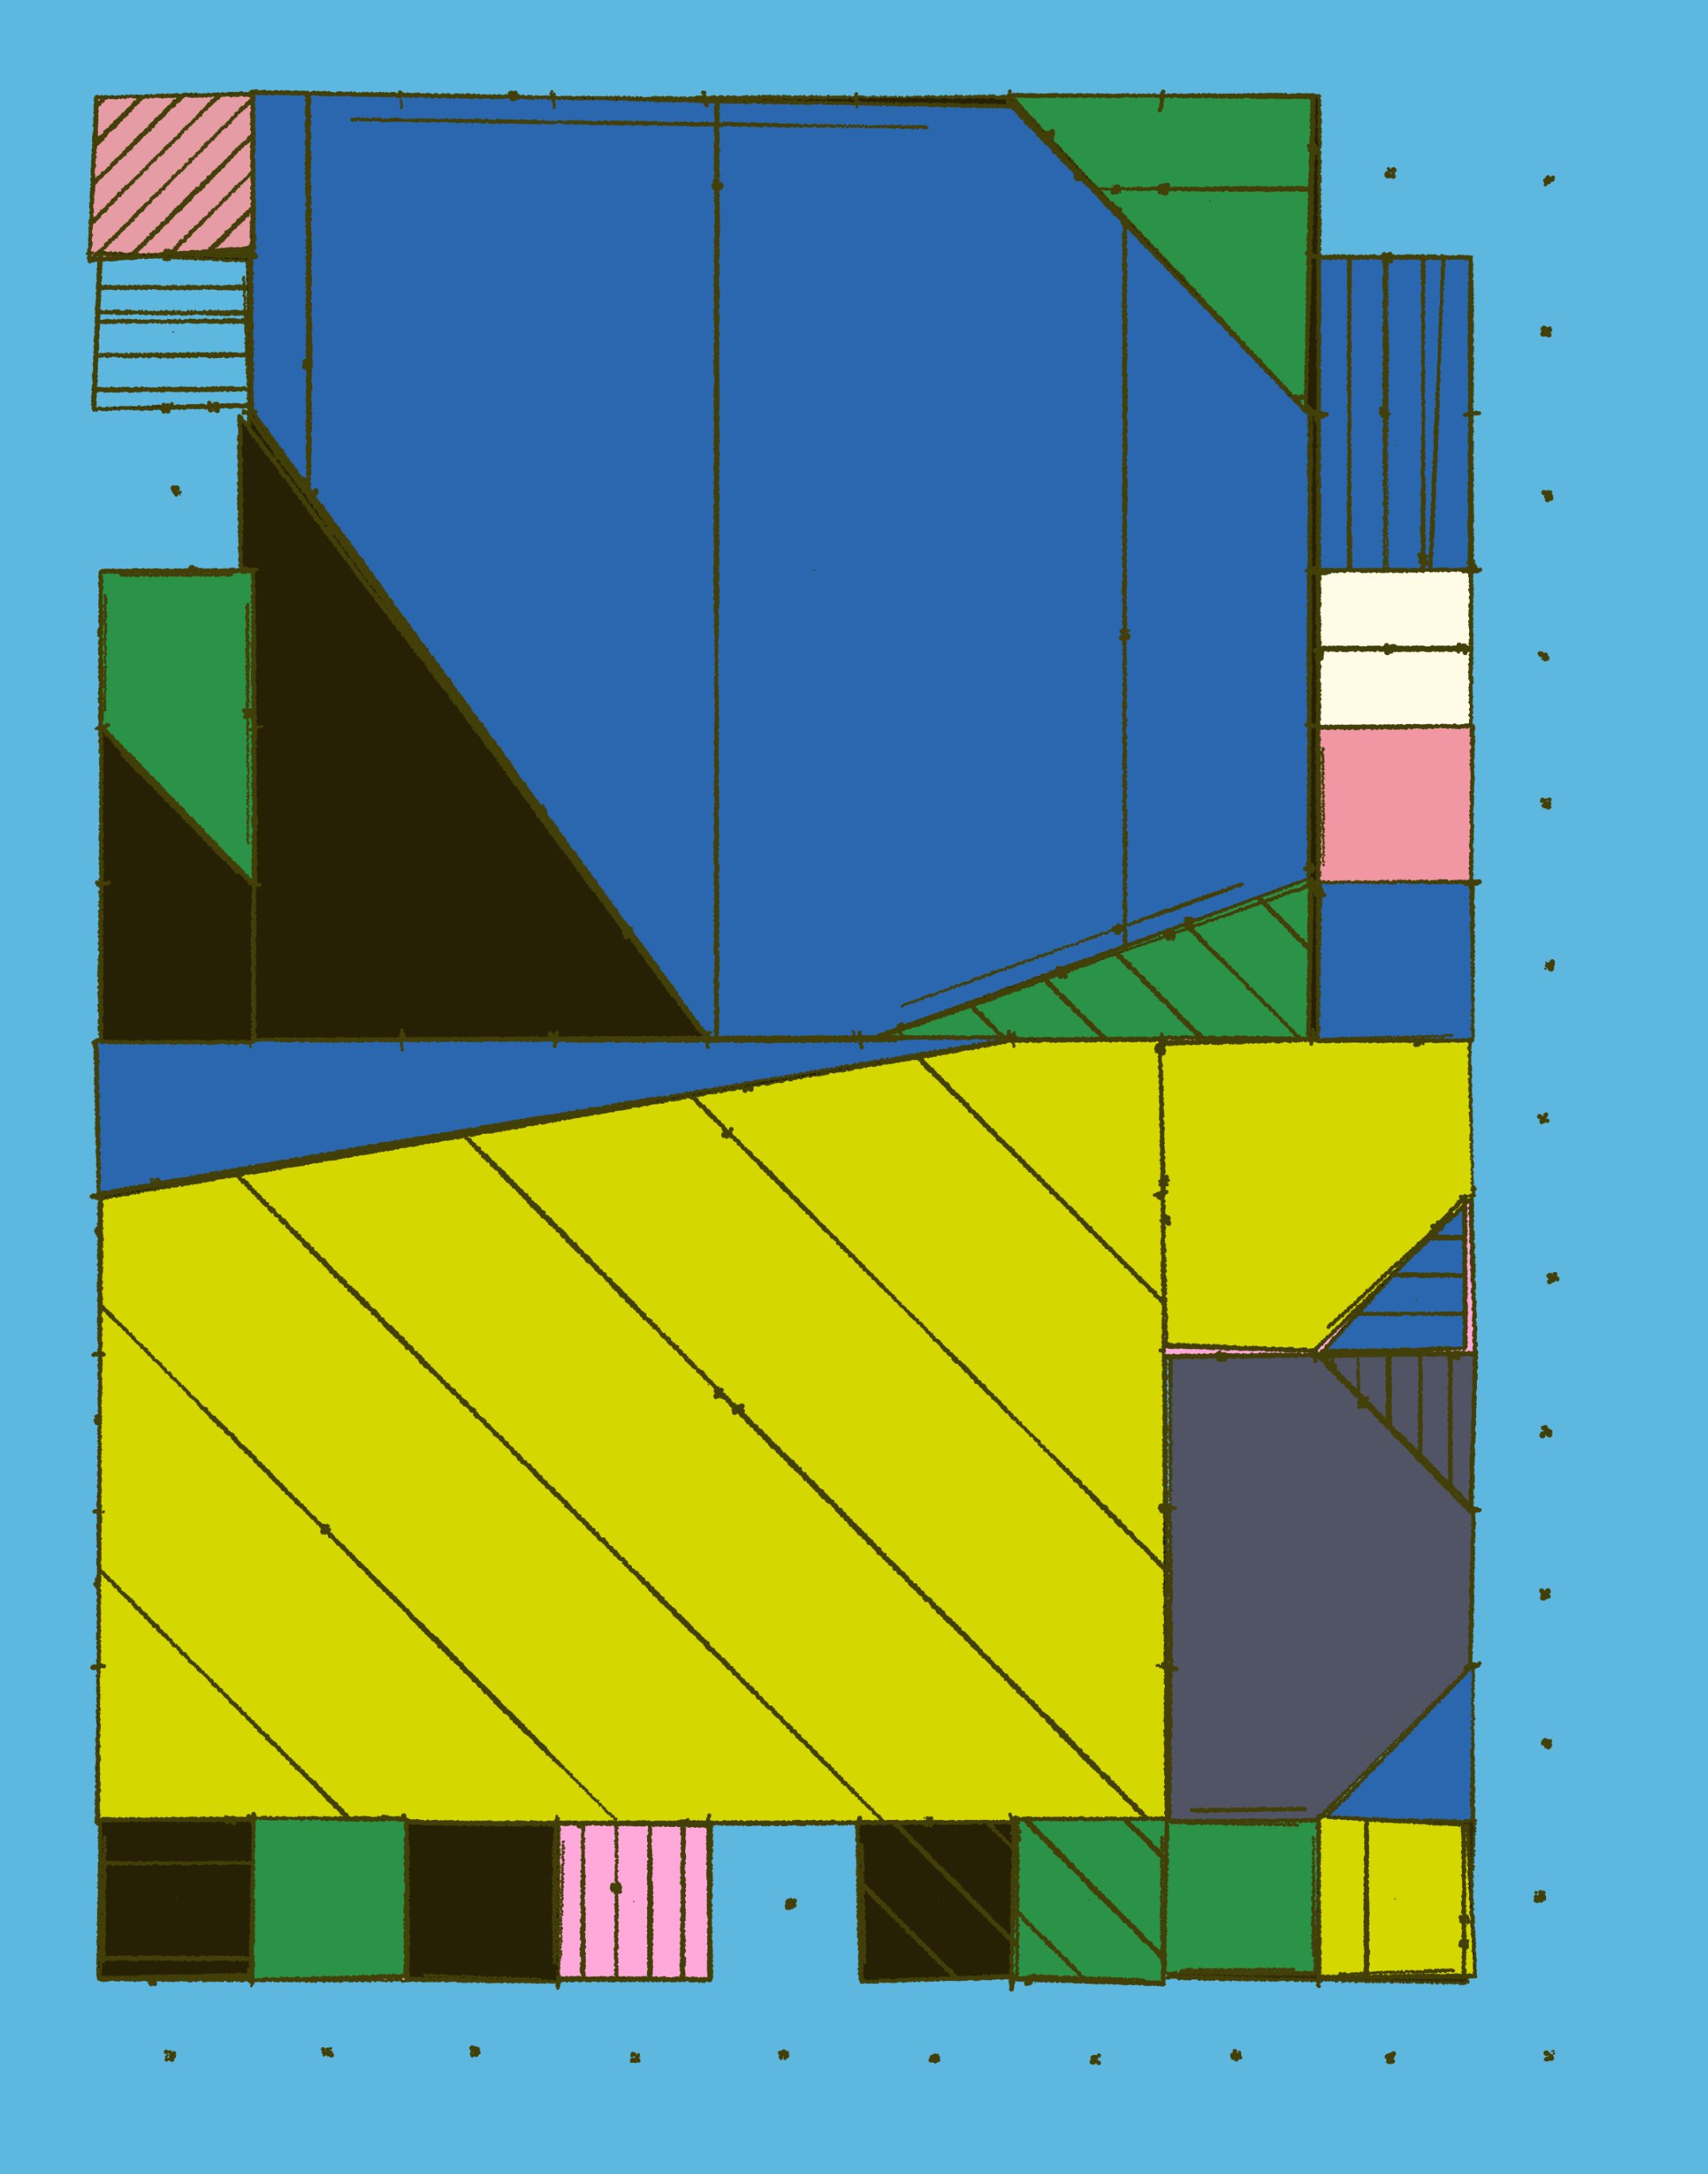
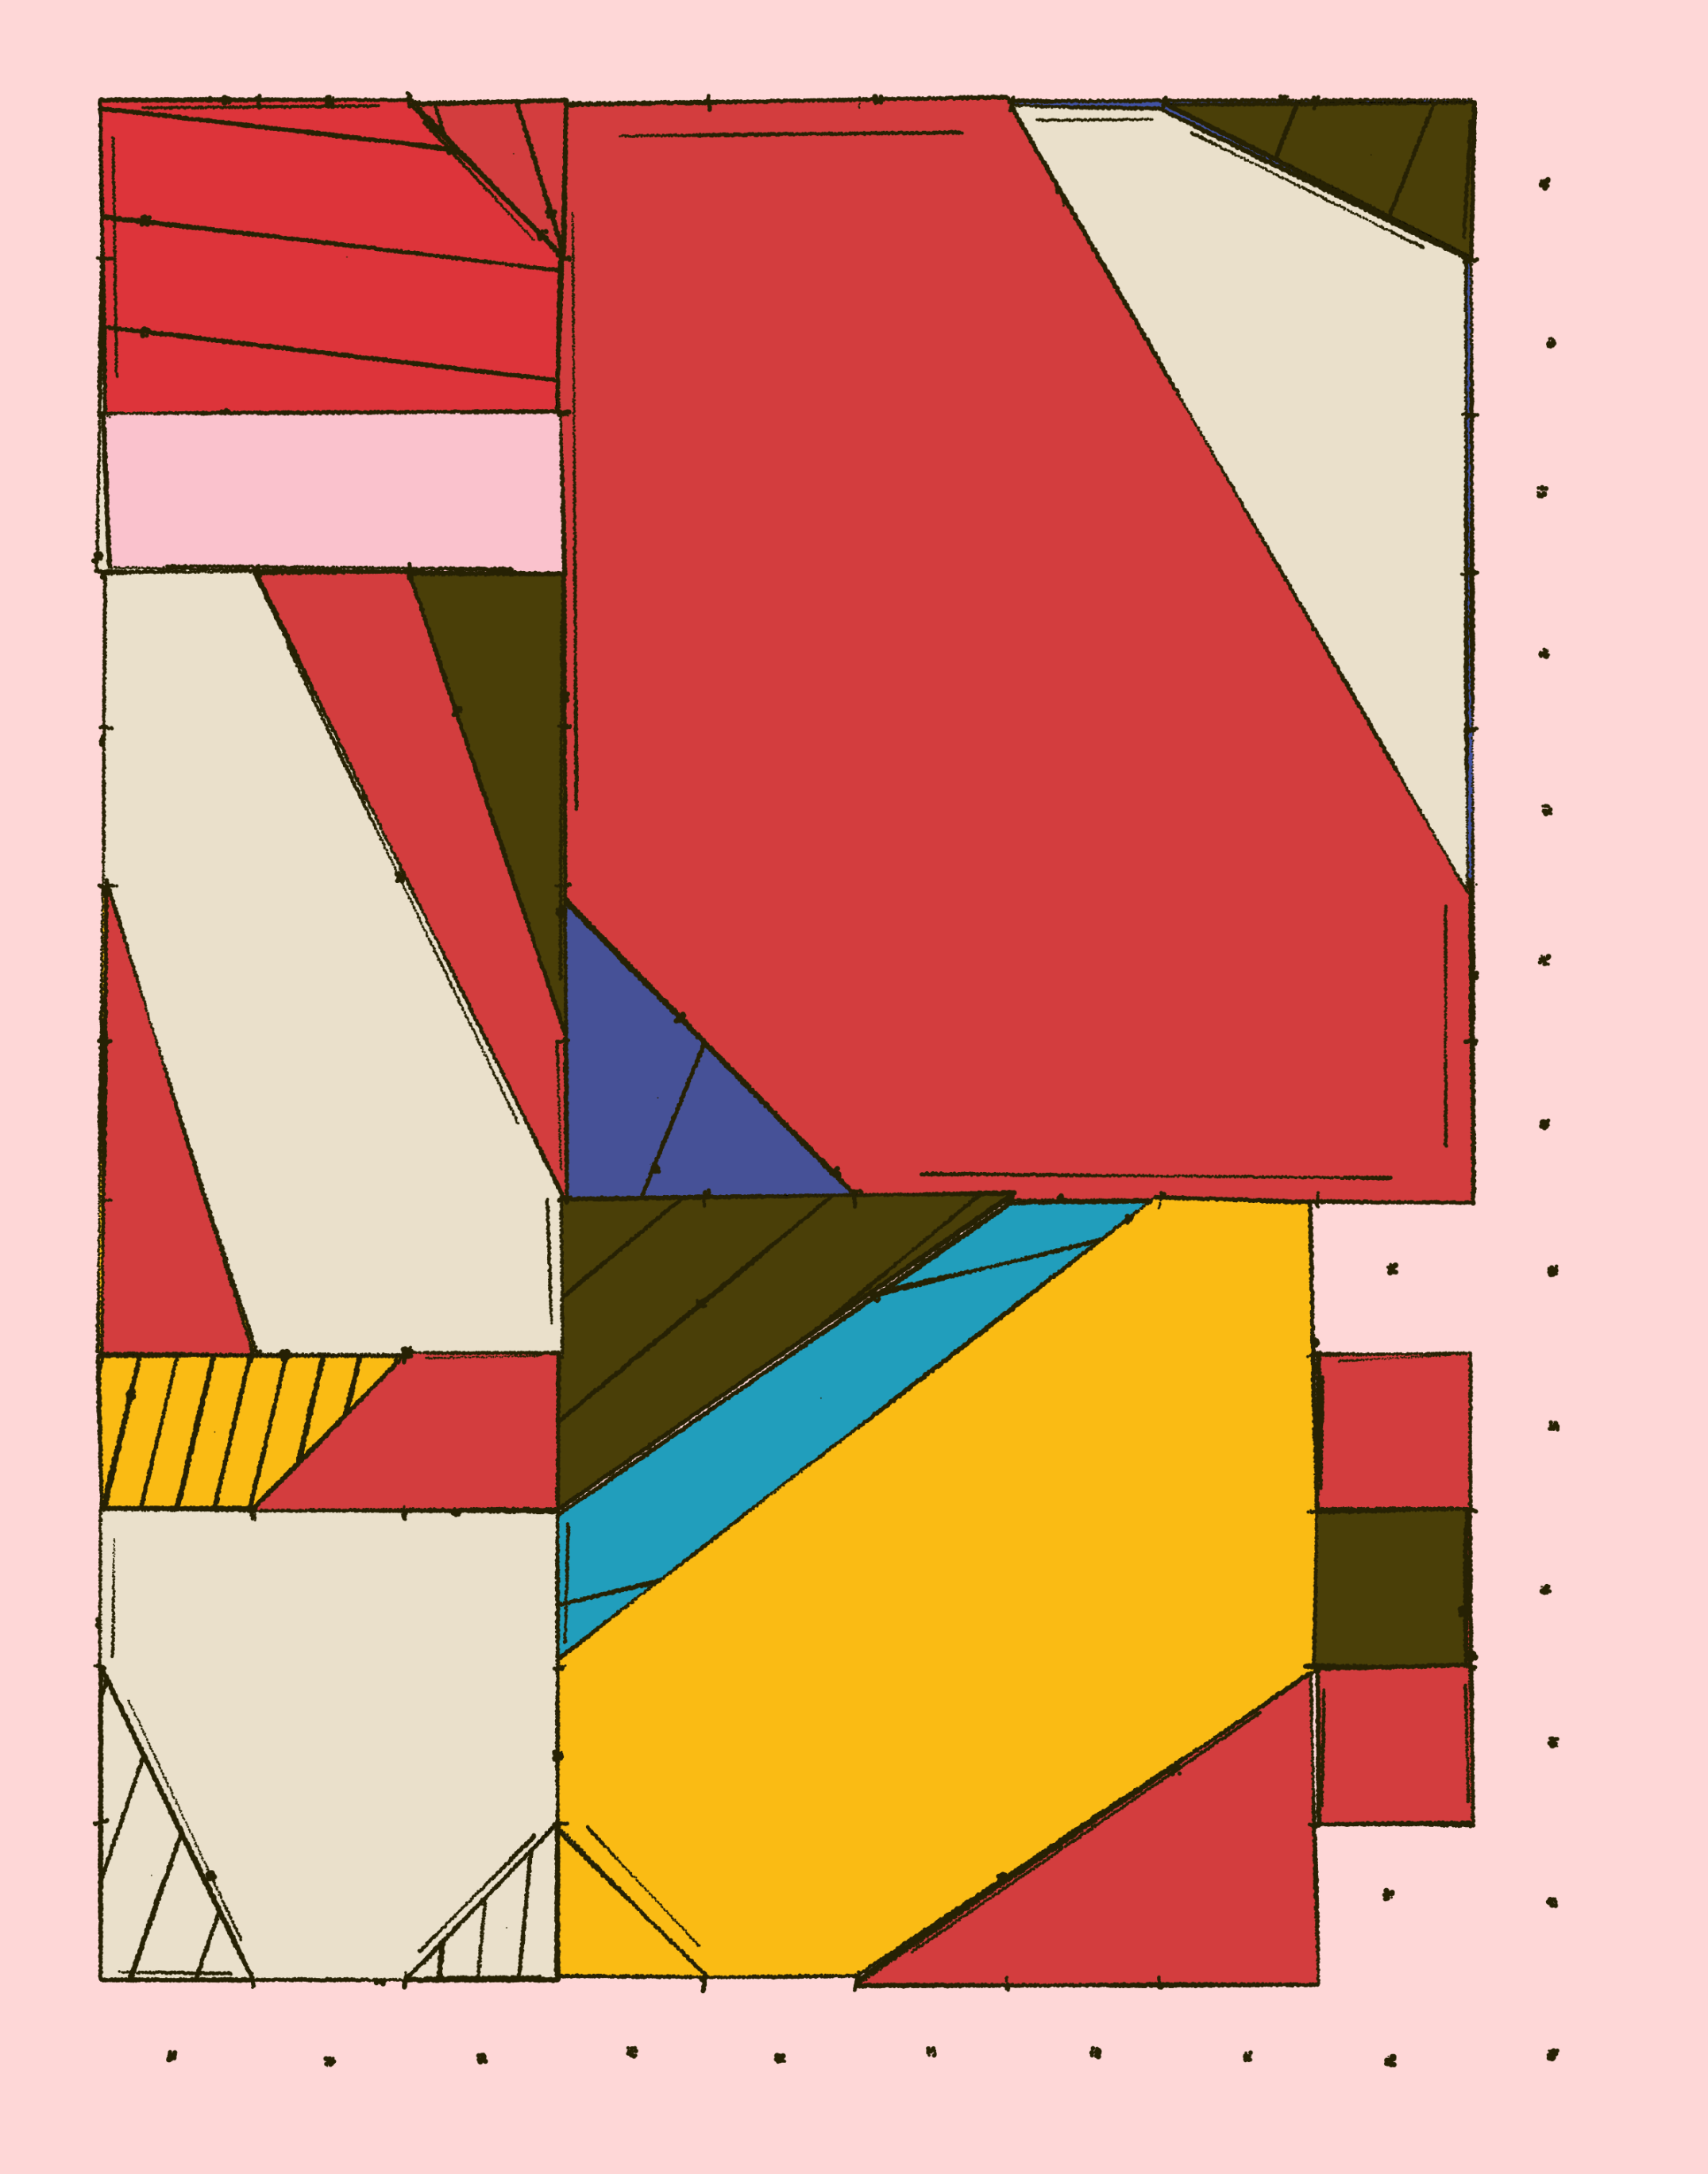
Initial iterations of the code. Here connections could still originate from the corners of the rectangle, something that doesn't occur in the final version. You can also notice that there's lines that overlap, due to a wrong calculation on my part. What I really like about these is the origami like quality, somehow resembling folder cardboard paper in a way.
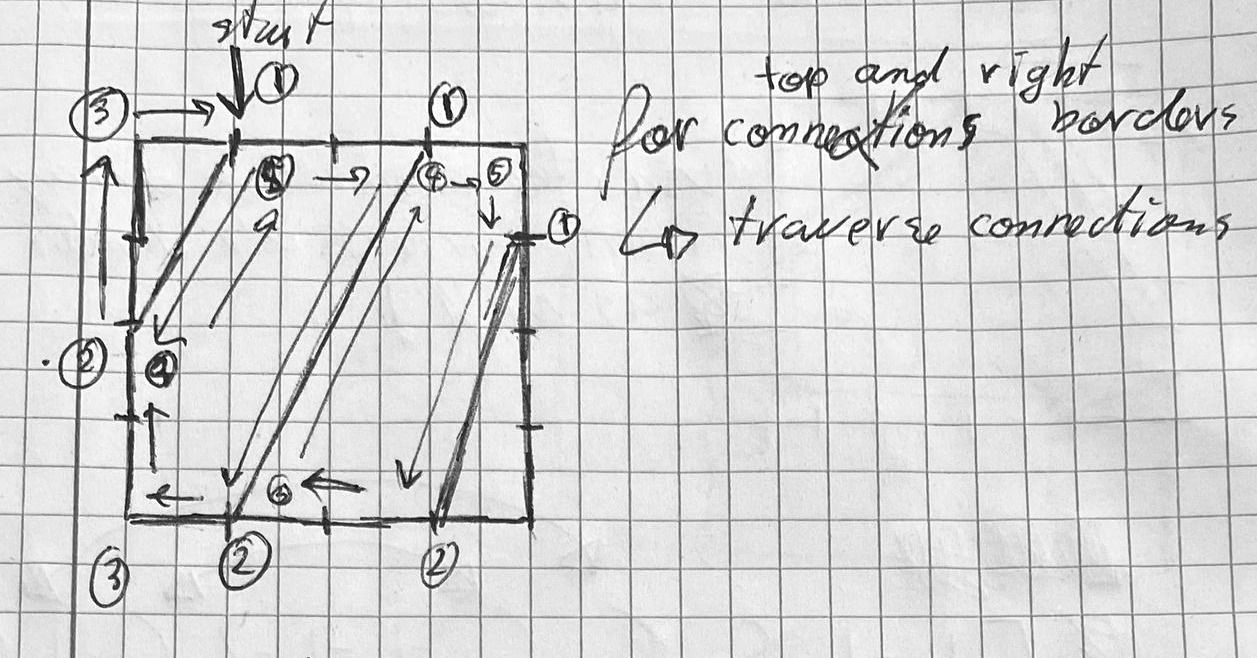
This geometric idea began as a simple drawing in my notebook, in which I placed some nodes/connections (not entirely sure what to call them) on the borders of a rectangle, and connected them in such a manner that they don't intersect each other. Visually, that produced pleasing patterns in which the rectangles were subdivided into smaller convex polygons that were neatly adjoined to each other.
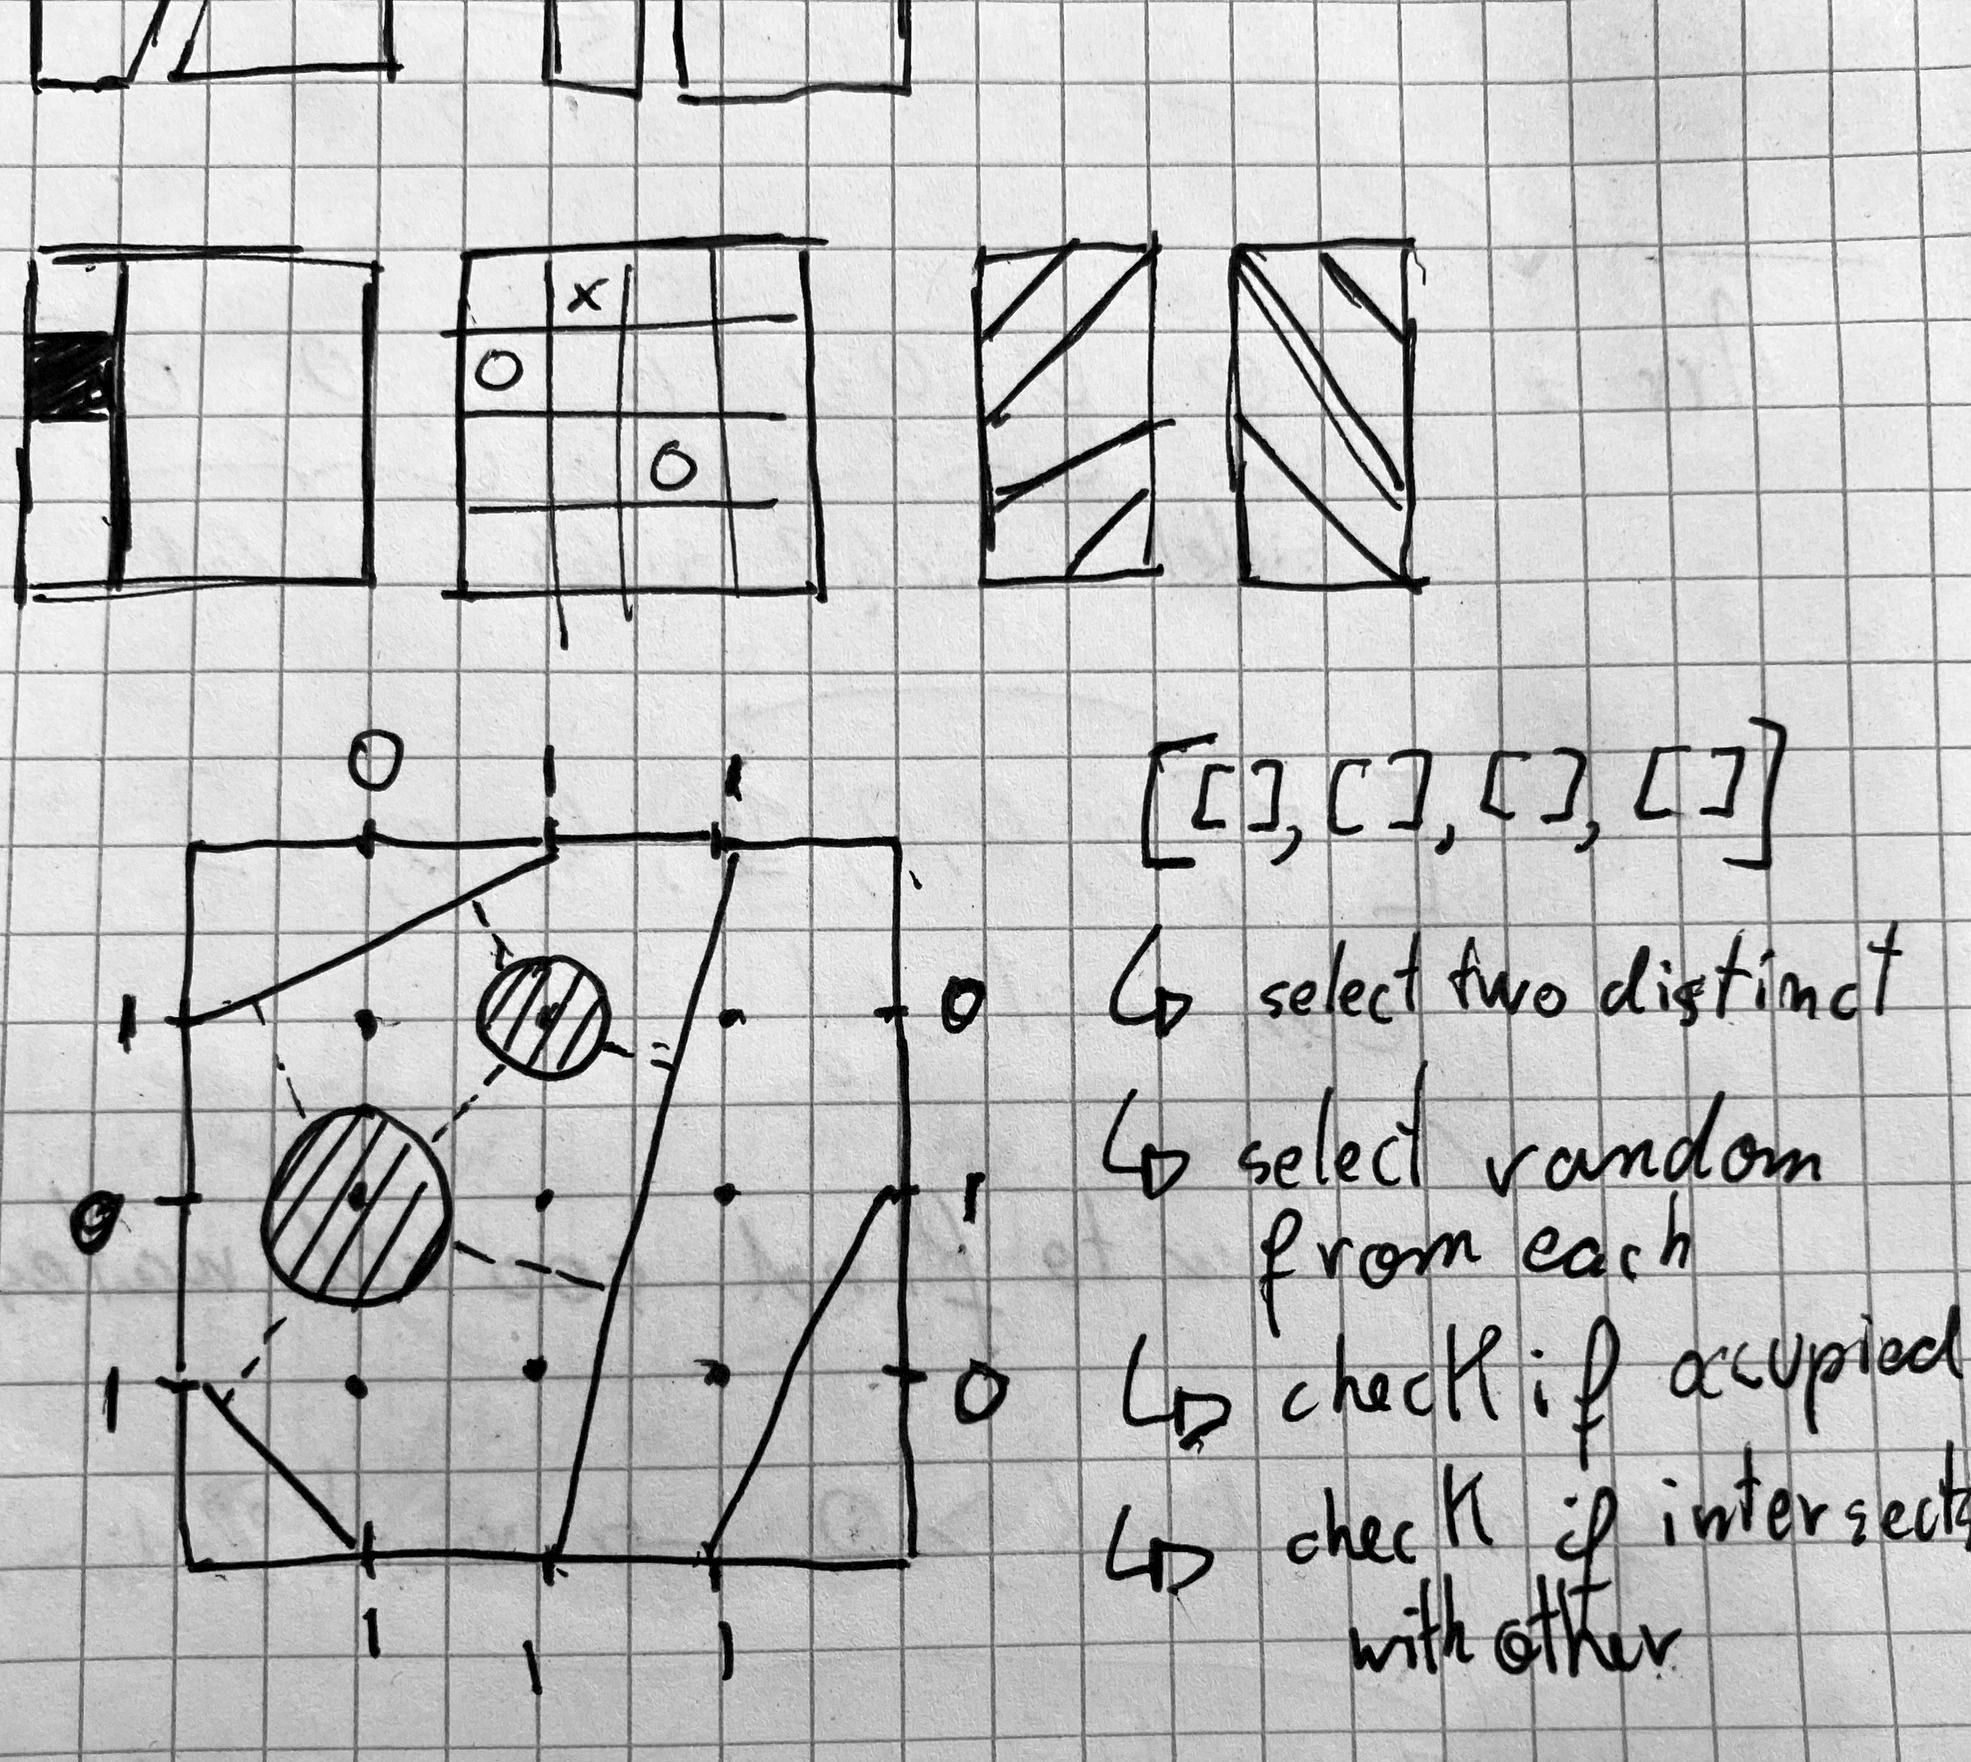
On paper, this was easier to do than in code. One idea would have been an object oriented approach, where each rectangle is an object that holds an array of nodes, that in turn are also objects storing their individual positions - in addition to references to the other nodes that they are connected to. An additional flag indicates if the node is connected or vacant.
I didn't want to go down the object oriented approach however, and wanted to do it in a different way. Many doodles down the line, I finally had a Eureka moment of some sorts, when I remembered a video by Nils Berglund that I had seen some weeks prior. The final approach ended up being one in which we unwrap the rectangle's boundaries into a 1 dimensional array - which is entirely sufficient to represent how the nodes are connected. Let me explain what that actually entails in the following sections.
Tokarski's Room
For this I'd like to backtrack and talk about a relatively unrelated topic: Tokarski's room.
There's a bit of a long backstory to what Tokarski's room is and the mathematical question that it poses, but to briefly summarize it: there are certain shapes of rooms, polygonal or not, in which two points can exist such that these two points don't illuminate each other. This is under the assumption that light travels in form in the form of directional rays, and that there is no diffraction of light. Tokarski came up with a very particular polygonal shape, in which there is a singular spot that remains completely dark.
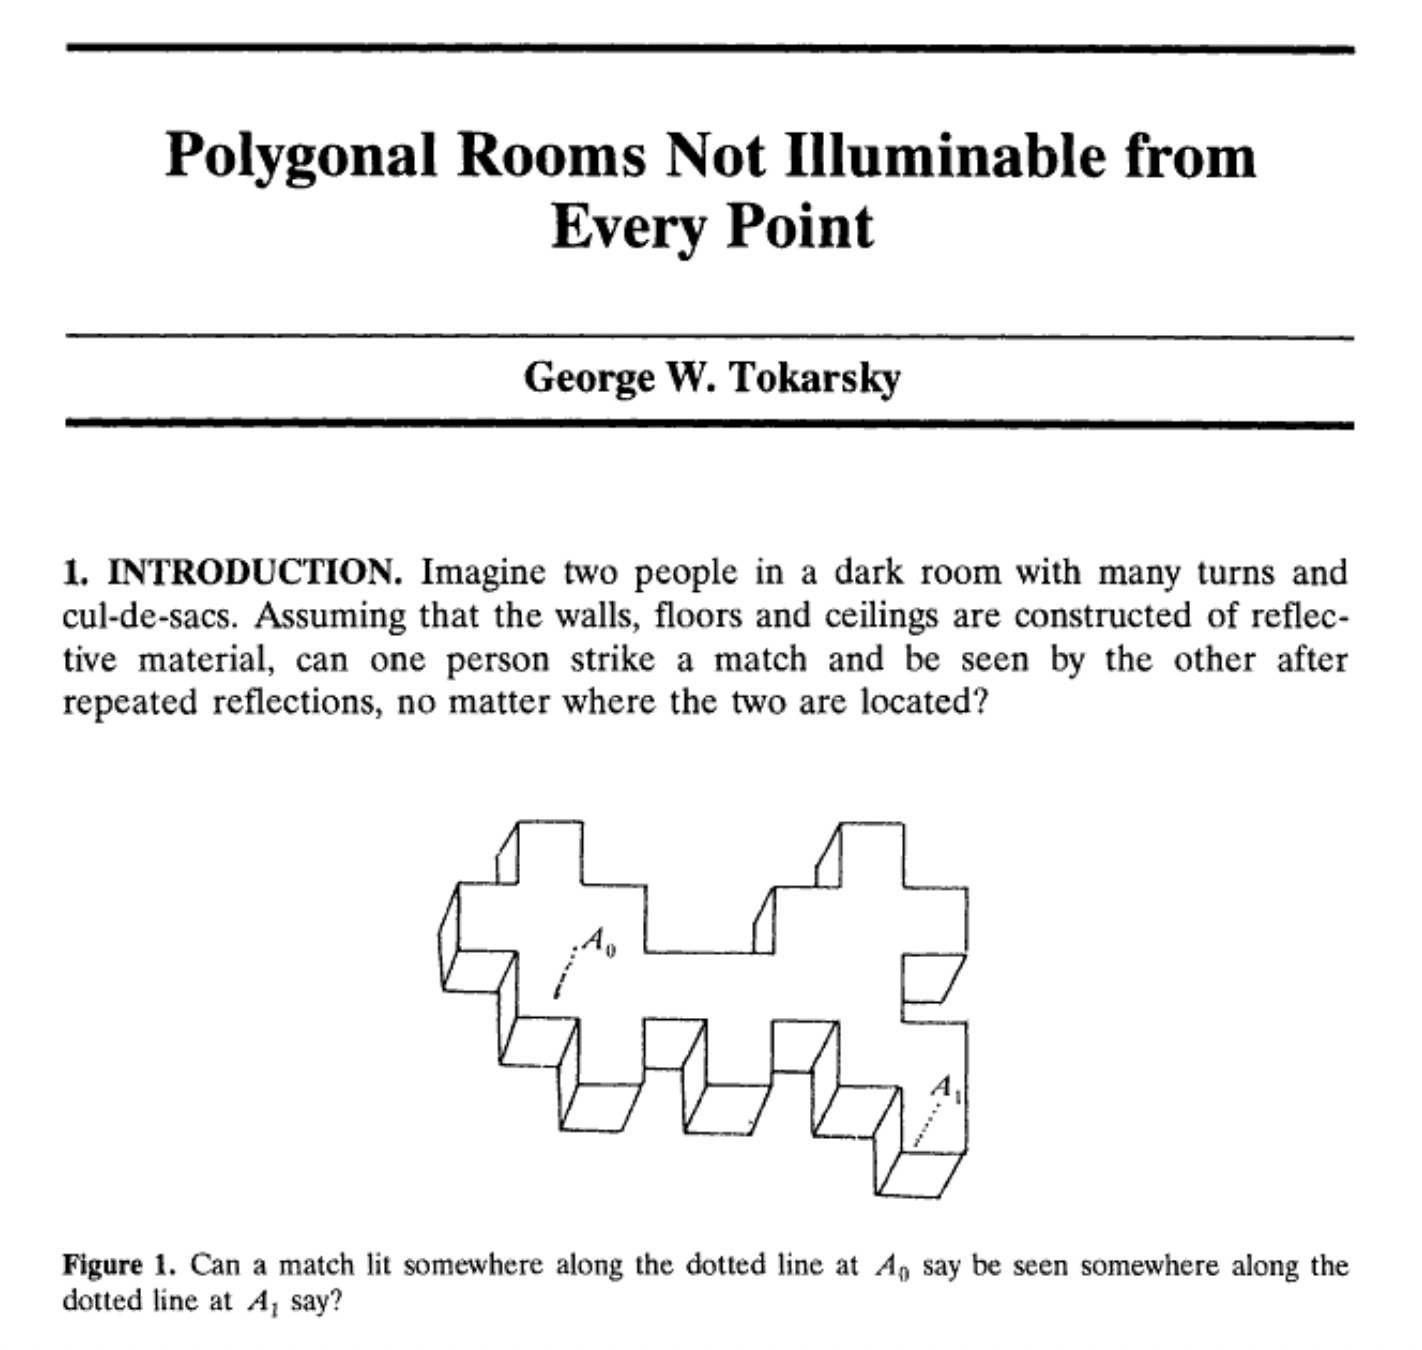
Nils Berglund's video explains how Tokarski came up with that shape, and he does so via analogy to a billiard table. Not a regular billiard table per se, but rather one that has the shape of a right angled triangle. A cool trick to predict the trajectory of a billiard ball is by unfolding the billiard table by reflection along it's boundaries. Drawing a straight line between the initial position of the ball and where you want it to go essentially shows you the initial direction that it has to be pushed in.
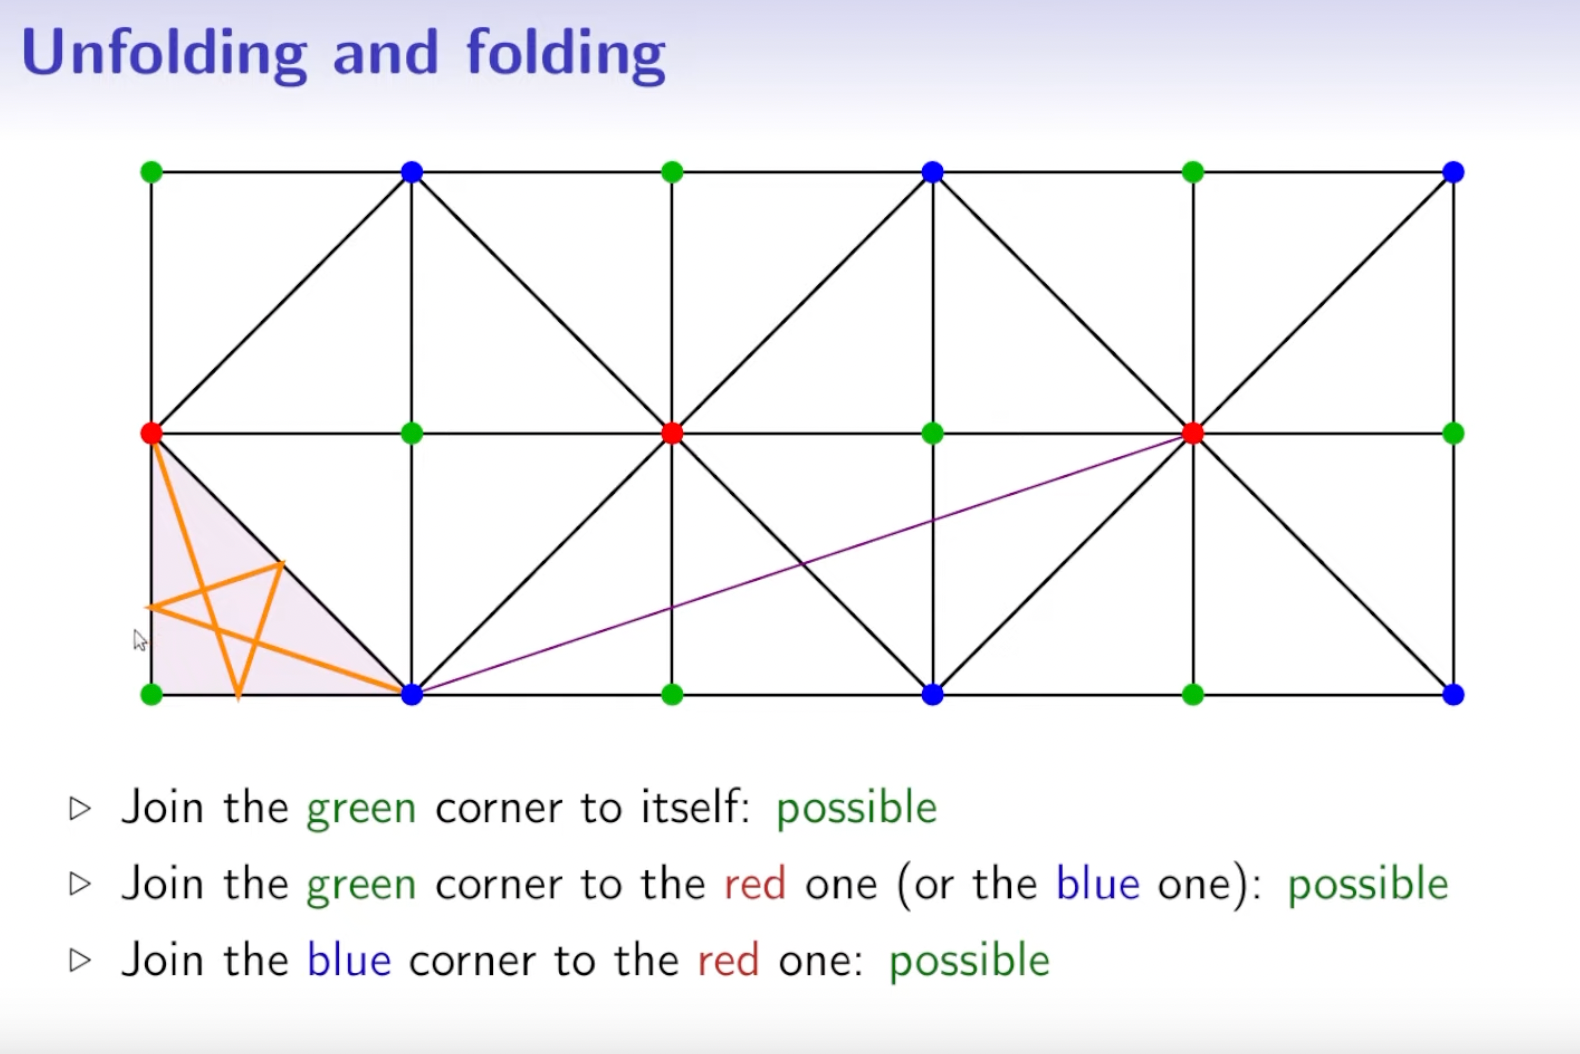
Now, the special thing about this triangular billiard table, is that there are certain points which can not be reached when starting from specific other points. For instance you can't return to the blue corner, if you start at a blue corner. And the same is true for the red corner.
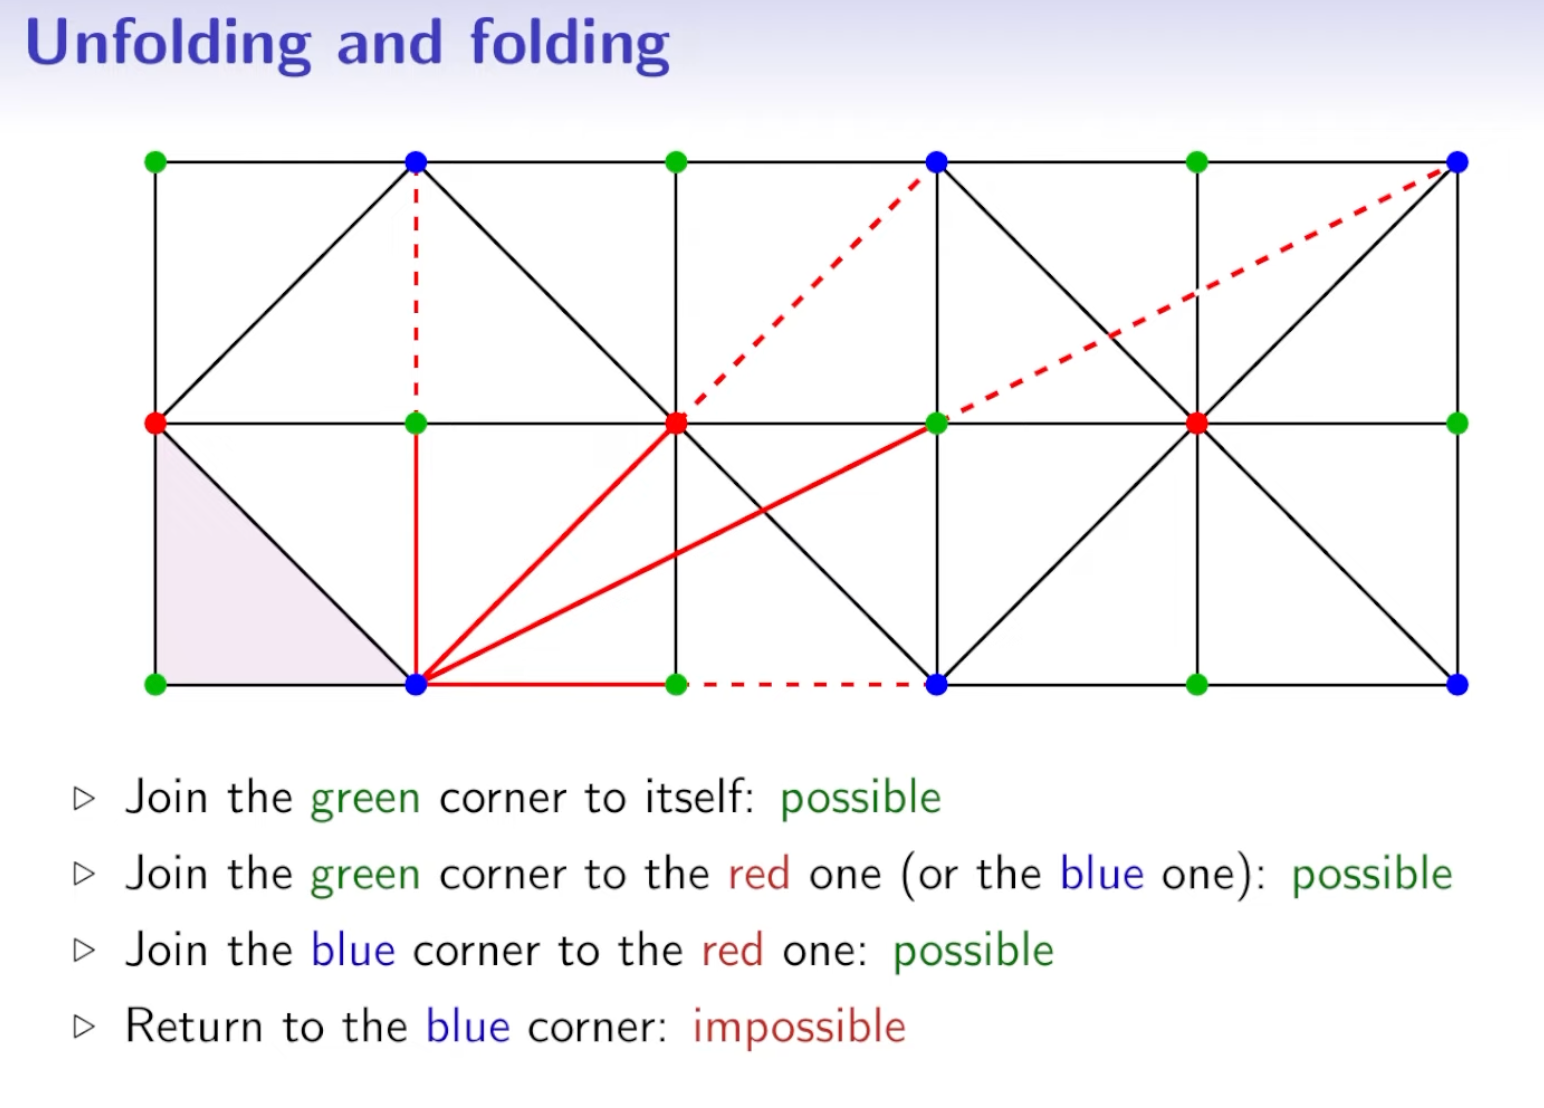
And this is essentially how Tokarski constructed his unilluminable room, by chaining together polygonal regions until there was a particular spot that could not be reached from a certain starting point. I recommend watching Nils' video, he does an amazing job at explaining the idea, as well as checking out his Youtube channel that, is a treasure trove of these kind of geometric notions:
Unwrapping Rectangles and Creating Connections
What does my idea have to do with Tokarski's room? Nothing, really.
Nils' video simply inspired a creative solution to my problem. To connect the nodes on the boundaries of our rectangles we don't actually need to know where they are located, since they are evenly spaced around the boundaries, we can compute their positions later on based on the dimensions of the rectangle itself.
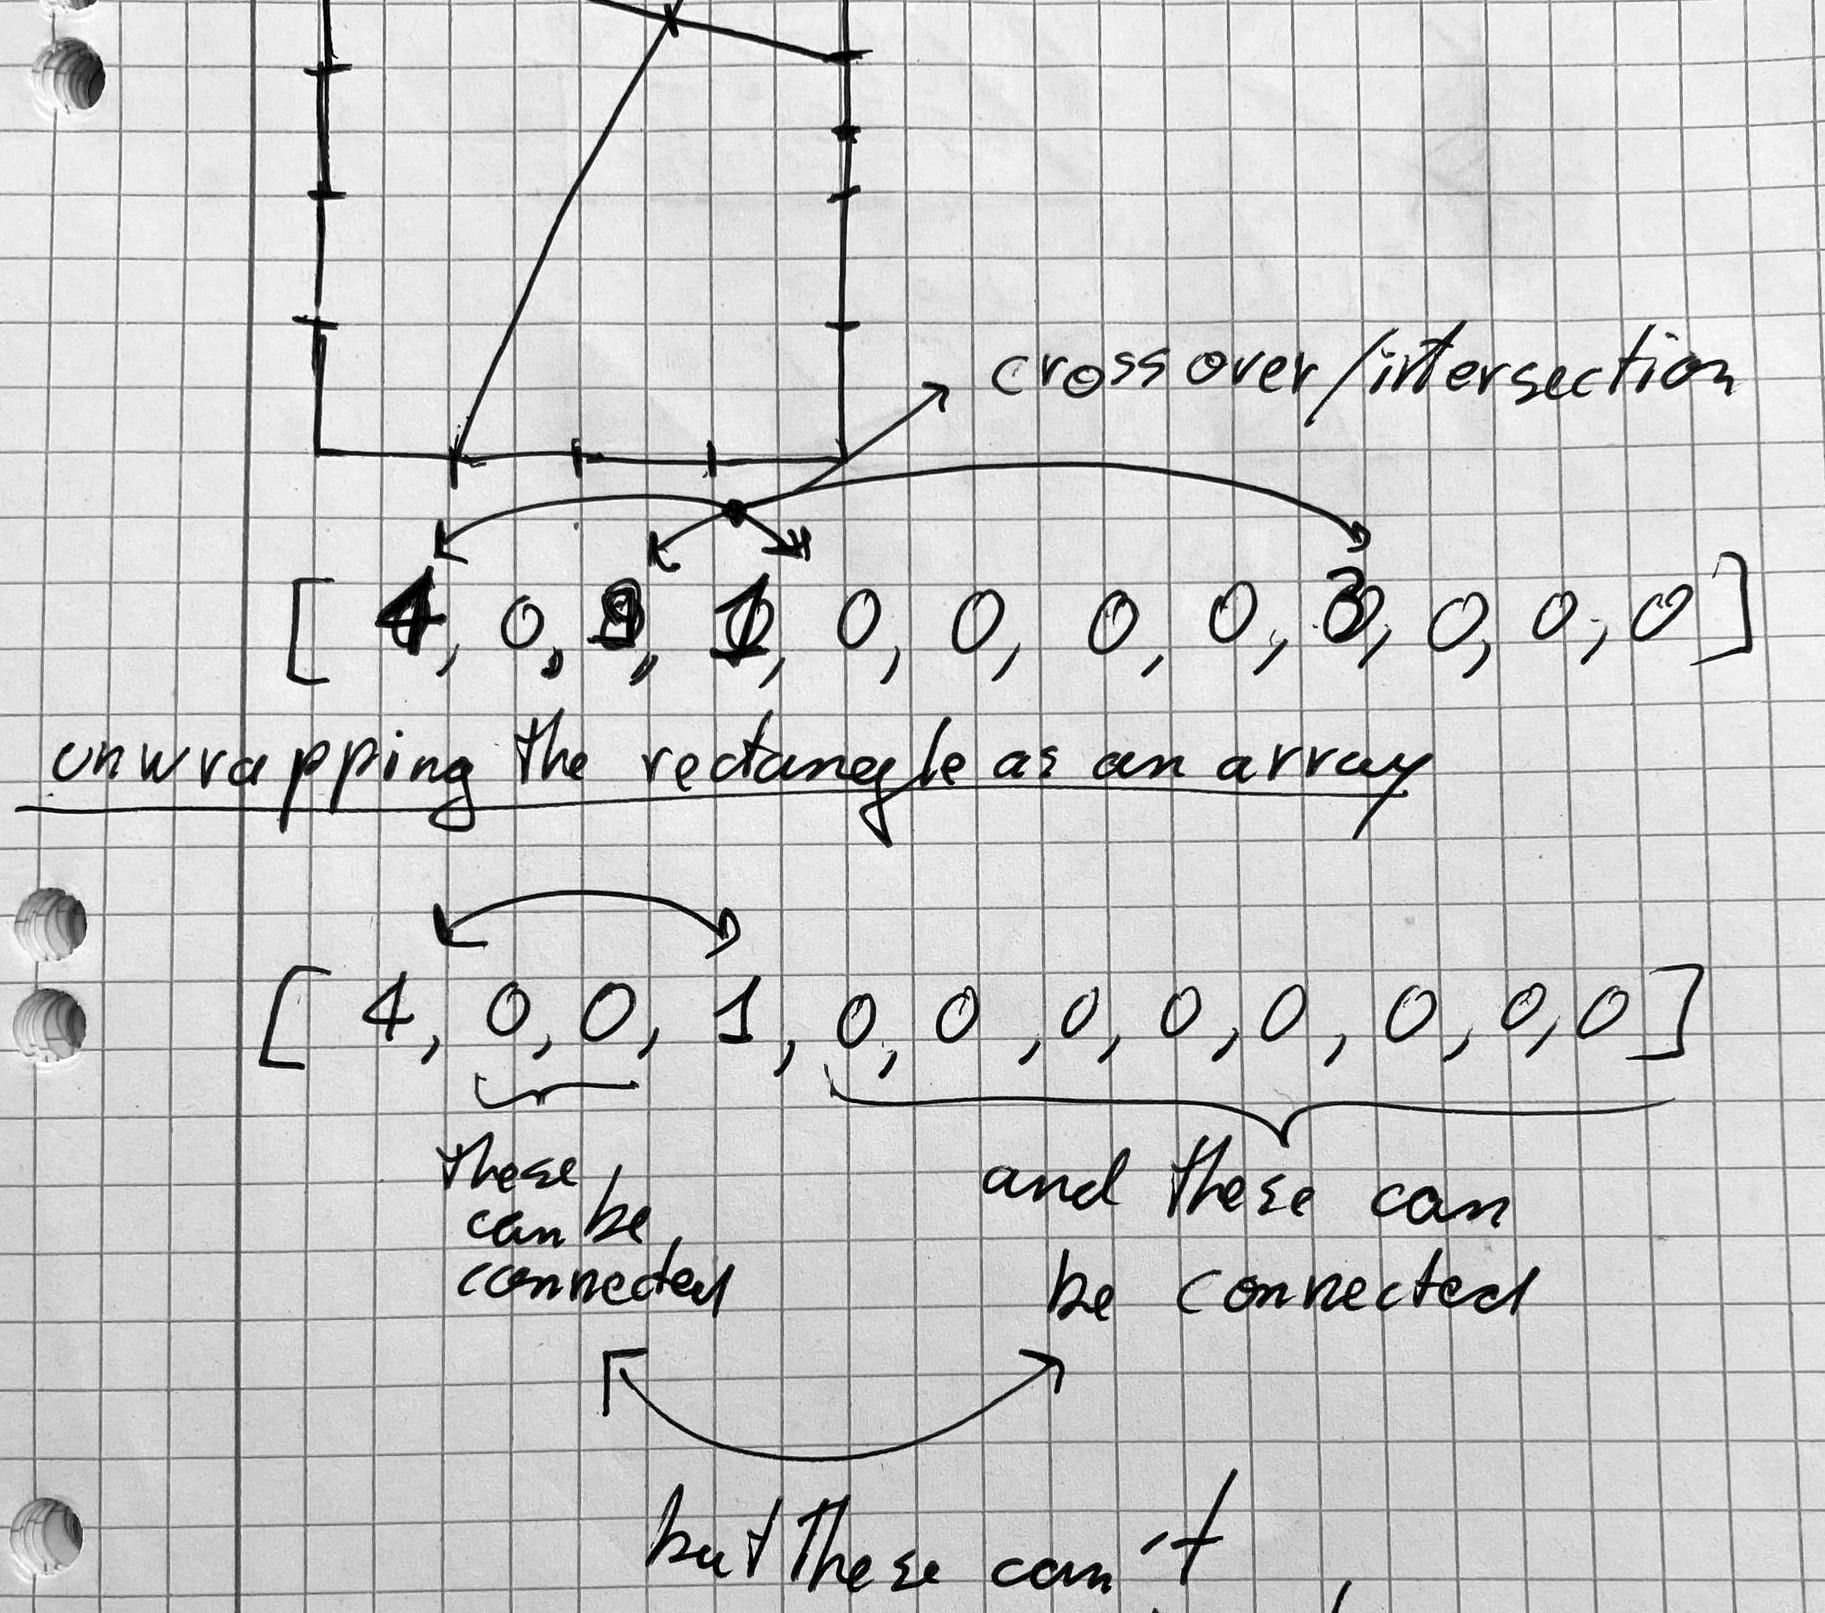
To represent how they're connected we can make do with a simple 1 dimensional array of integers, where each entry in this array represents one of the nodes, starting from the top-left corner of the rectangle and traversing the boundaries in clockwise order. This means that the indices in the array represent the nodes in clockwise order, and we can create a simple mapping to which other node each node is connected by storing the corresponding indices.
In this manner we are unfolding the rectangle into a lower dimension. That is the extent of the inspiration from Tokarski's room.
To aid our understanding, let's have a look at an example. Imagine we have a rectangle that spans three by three cells in our irregular grid (the irregular grid being a discrete grid of cells). This means that the rectangle has 2 nodes on each boundary, 8 in total since the corners themself cannot be vacant nodes. The array would look as follows:
// we can initialize this array with a one-liner
[-1, -1, -1, -1, -1, -1, -1, -1]
I chose the negative integer 1 to indicate that a node is vacant. Now let's assume that the first node is connected to the 5-th node, we can do so pointing the two corresponding array entries to each other:
// indexing begins at 0
[4, -1, -1, -1, 0, -1, -1, -1]
And in this manner we have established connectivity between the first and the fifth node.
An important thing here, is that when we add new connections, we have to make sure that these new connections don't create lines that intersect with the already existing connections. If we were to go down the object oriented approach, then we would have to manually check for these intersections, which I've written about in a section of this post if you're curious about it:
Determining if two polygons intersect boils down to checking if two of their constituent lines intersect.
Our array already provides a way to check for intersections however! When creating the subsequent connections, we simply check if any of the array entries in between the two new connection nodes are not equal to -1; if there is at least one, then we can't establish that connection because it would lead to crossing lines.
And this is essentially the core idea of the generative sketch.
Determining polygonal regions
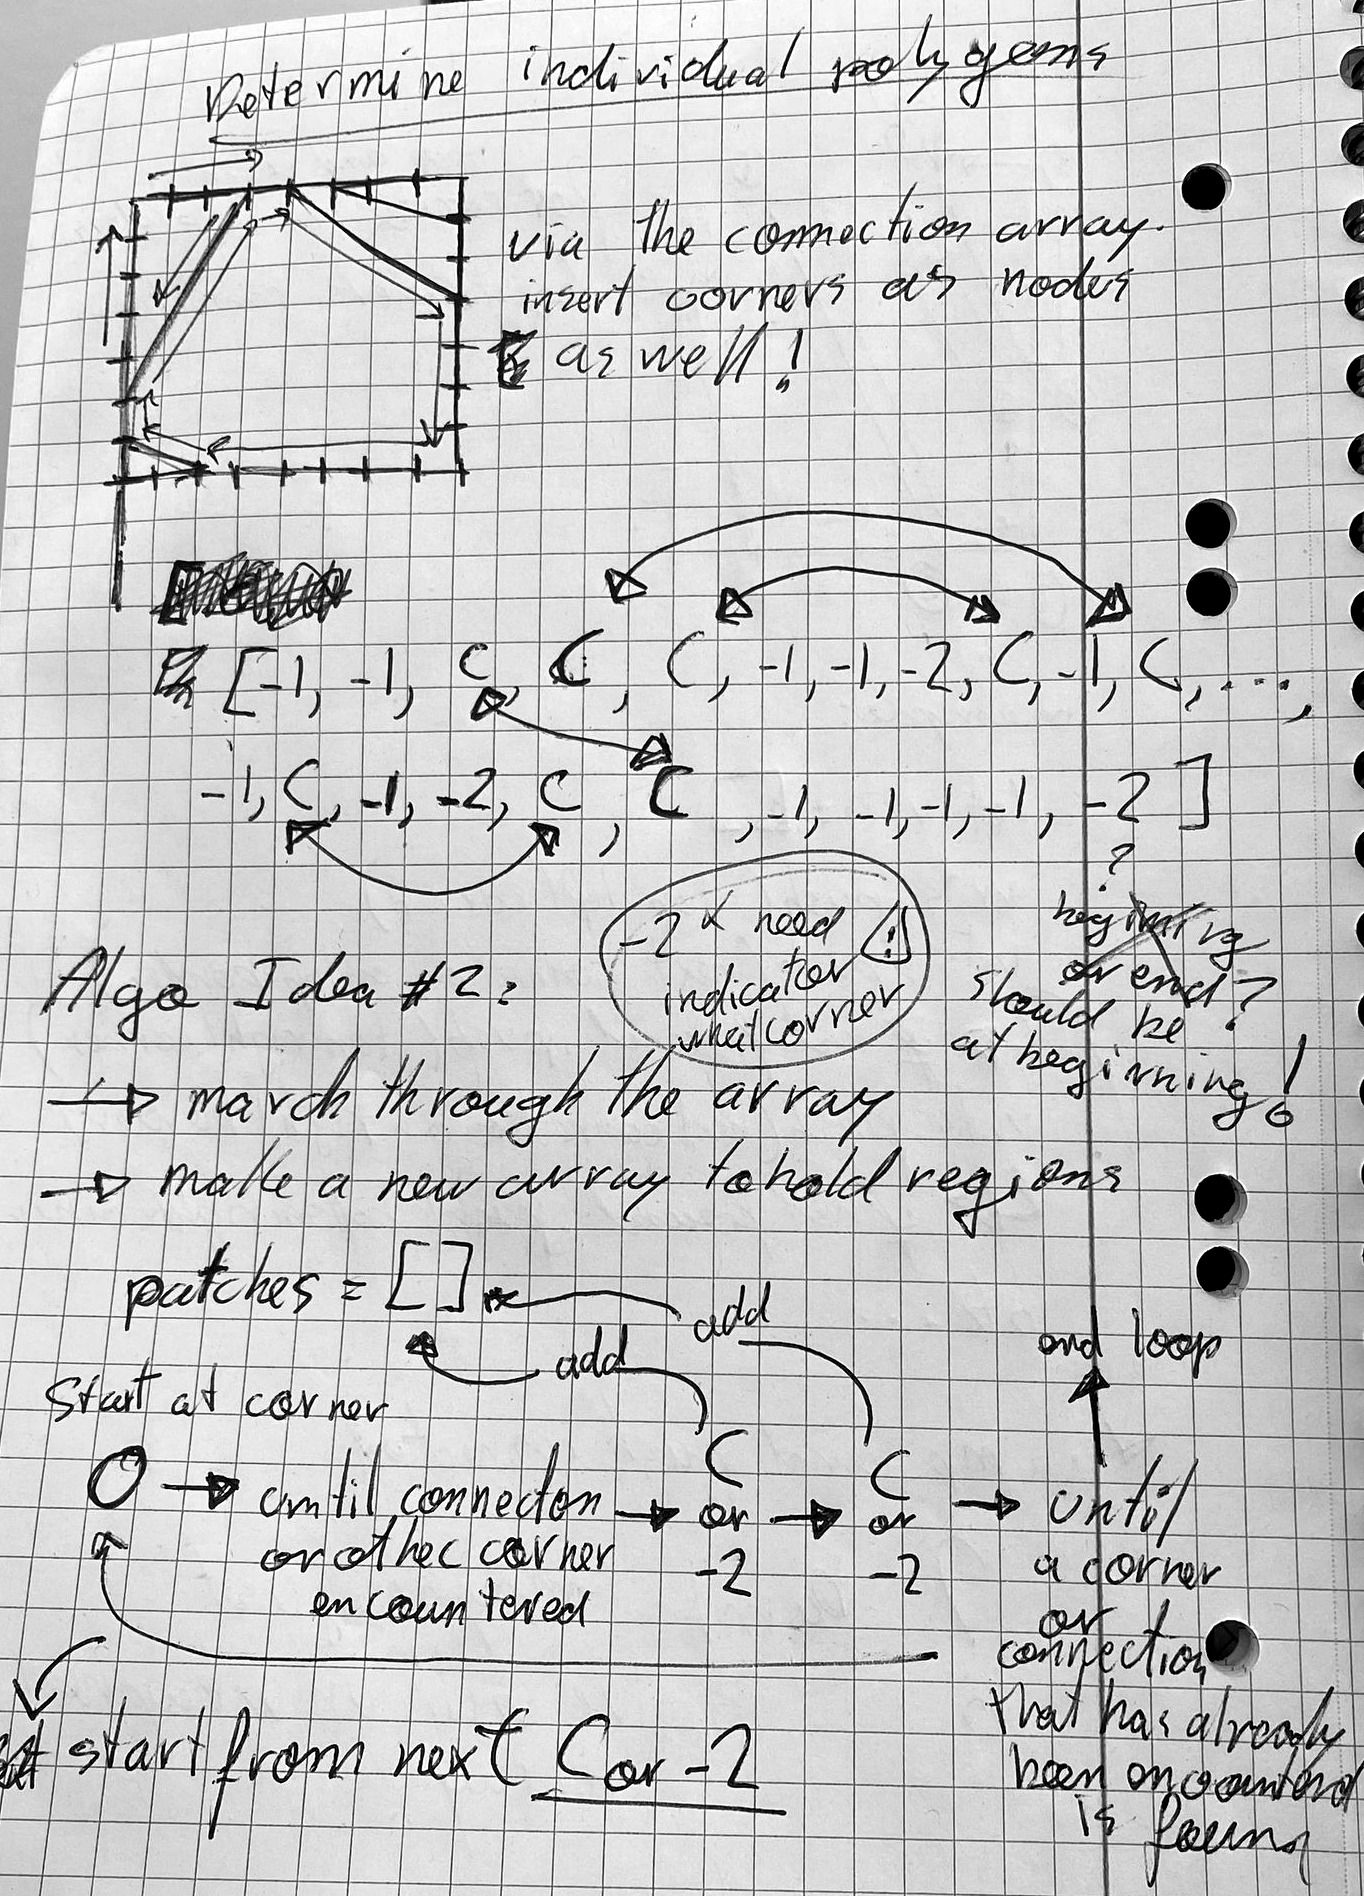
Now the cherry on top, is that this array is also sufficient to determine and isolate the different polygonal regions that emerge. Determining these polygonal regions is necessary to create the different clip regions and filling them in with patterns.
The idea here is again very simple. The code however became quite gnarly.
For the polygonal regions we need to also take into consideration the corners of the rectangle, which we'll add into the array and represent with the special numbers from -2 to -5. It'll be important to be able to distinguish between the different corners, starting from the top-left, and moving along in a clockwise order. The number -1 still indicates that a node is vacant:
// -2 represents a corner of the rectangle
[-2, 4, -1, -3, -1, -1, -4, 0, -1, -5, -1, -1]
But you might have noticed that this also threw off the ordering of our nodes, and that they're not mapping to each other in a correct manner anymore, so we need to offset them as well, simply by adding the number of corner insertions:
// offsetting the connection indices
[-2, 7, -1, -3, -1, -1, -4, 1, -1, -5, -1, -1]
And now the array is correct again. So, how does this 1 dimensional array inform us about the polygonal regions? The best way to imagine this is by doing a contour walk on the rectangle with it's connections. Let's start traversing the array from the top-left corner.
We create a new polygon, similarly as a 1d array that stores the nodes and corners that determine it's vertices. The traversal algorithm consists of the following rules:
- Traverse the connectivity array from left to right.
- When we encounter a number that is not equal to -1 we add it to the polygon array.
- When we encounter a non-negative number we jump to the corresponding index in the array and resume traversing from there.
- When we reach the end of the array we loop around.
- When the same number is encountered a second time we stop traversing. We store the polygon array, and repeat these steps starting from the polygon's second vertex.
- When we reach the same node that we did our initial traversal from, we end the procedure.
- Remove duplicate polygons.
So this is quite confusing, and it was also quite confusing to implement, but it works. This is essentially sort of a contour traversal done on a 1 dimensional array.
You can have a look at the messy code by inspecting the token over on FxHash. And again, this probably makes much more sense by having a look at one of the diagrams that helped figure this out.
And the pseudocode:
What I think is special about this, is that it should theoretically work for every convex polygon, but then it requires extra computation to compute the absolute coordinates of the connections.
Computing the absolute coordinates of the nodes
This was also tricky to do. Since the connectivity array has no knowledge of where the nodes are, we need to go through some extra steps to determine where they are located on the rectangle, based on it's dimensions. This will be the only code that I show in this article, because it was especially ugly - and I think there's something beautiful about that:
for (let n = 0; n < this.connections.length; n++) {
  let connection = this.connections[n]

  if (connection > -1) {
    let startX = 0
    let startY = 0
    if (n - (this.dimX - 1) < 0) {
      startX = this.vrts[0].x + n * gridSpacingX + gridSpacingX
      startY = this.vrts[0].y
    } else if (n - ((this.dimX - 1) + (this.dimY - 1)) < 0) {
      startX = this.vrts[0].x + this.dimX * gridSpacingX
      startY = this.vrts[0].y + (n - (this.dimX - 1)) * gridSpacingY + gridSpacingY
    } else if (n - ((this.dimX - 1) * 2 + (this.dimY - 1)) < 0) {
      startX = this.vrts[0].x + this.dimX * gridSpacingX - (n - ((this.dimX - 1) + (this.dimY - 1))) * gridSpacingX - gridSpacingX
      startY = this.vrts[0].y + this.dimY * gridSpacingY
    } else {
      startX = this.vrts[0].x
      startY = this.vrts[0].y + (this.dimY - 1) * gridSpacingY - (n - ((this.dimX - 1) * 2 + (this.dimY - 1))) * gridSpacingY
    }
  }
}
Final touches
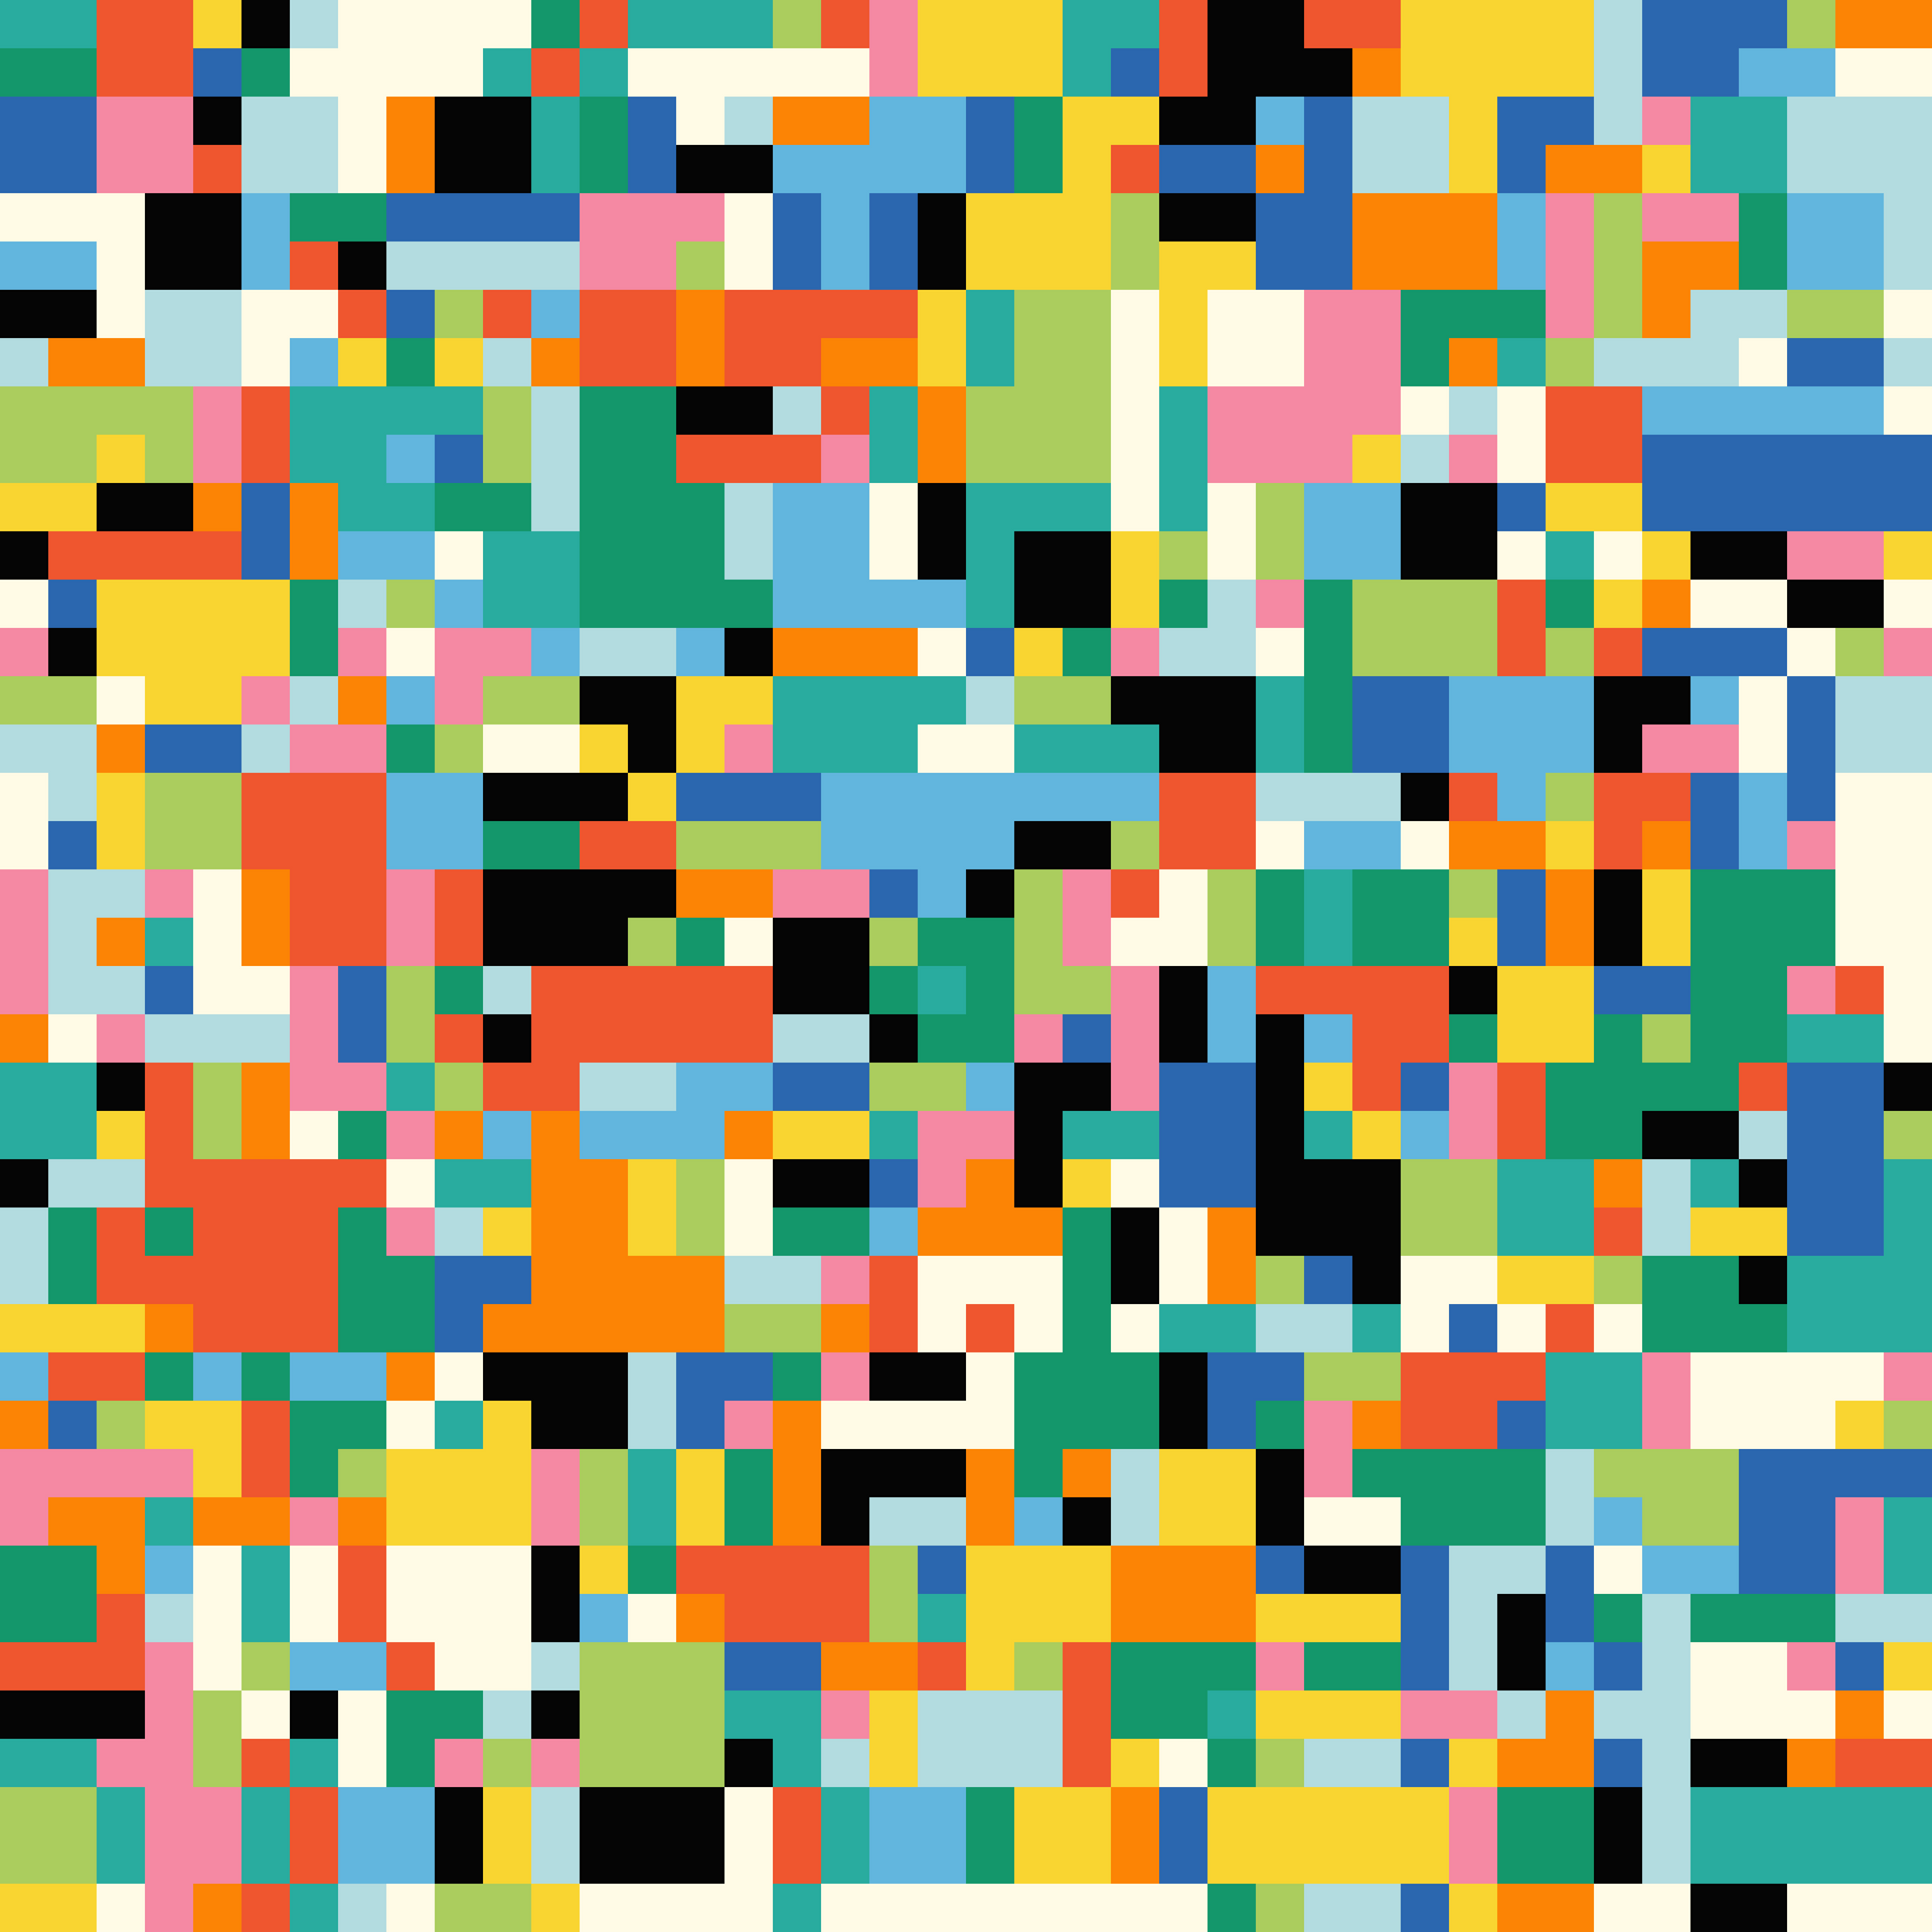
Unintentionally I called my custom line drawing function twice in the main loop, and that actually resulted in a beefier look overall, which I ended up liking much more than the original variation. It gave the lines a heftier look overall.

Sometimes there's also stroke colors that aren't pure black, which gives the overall composition a slightly dreamier look.
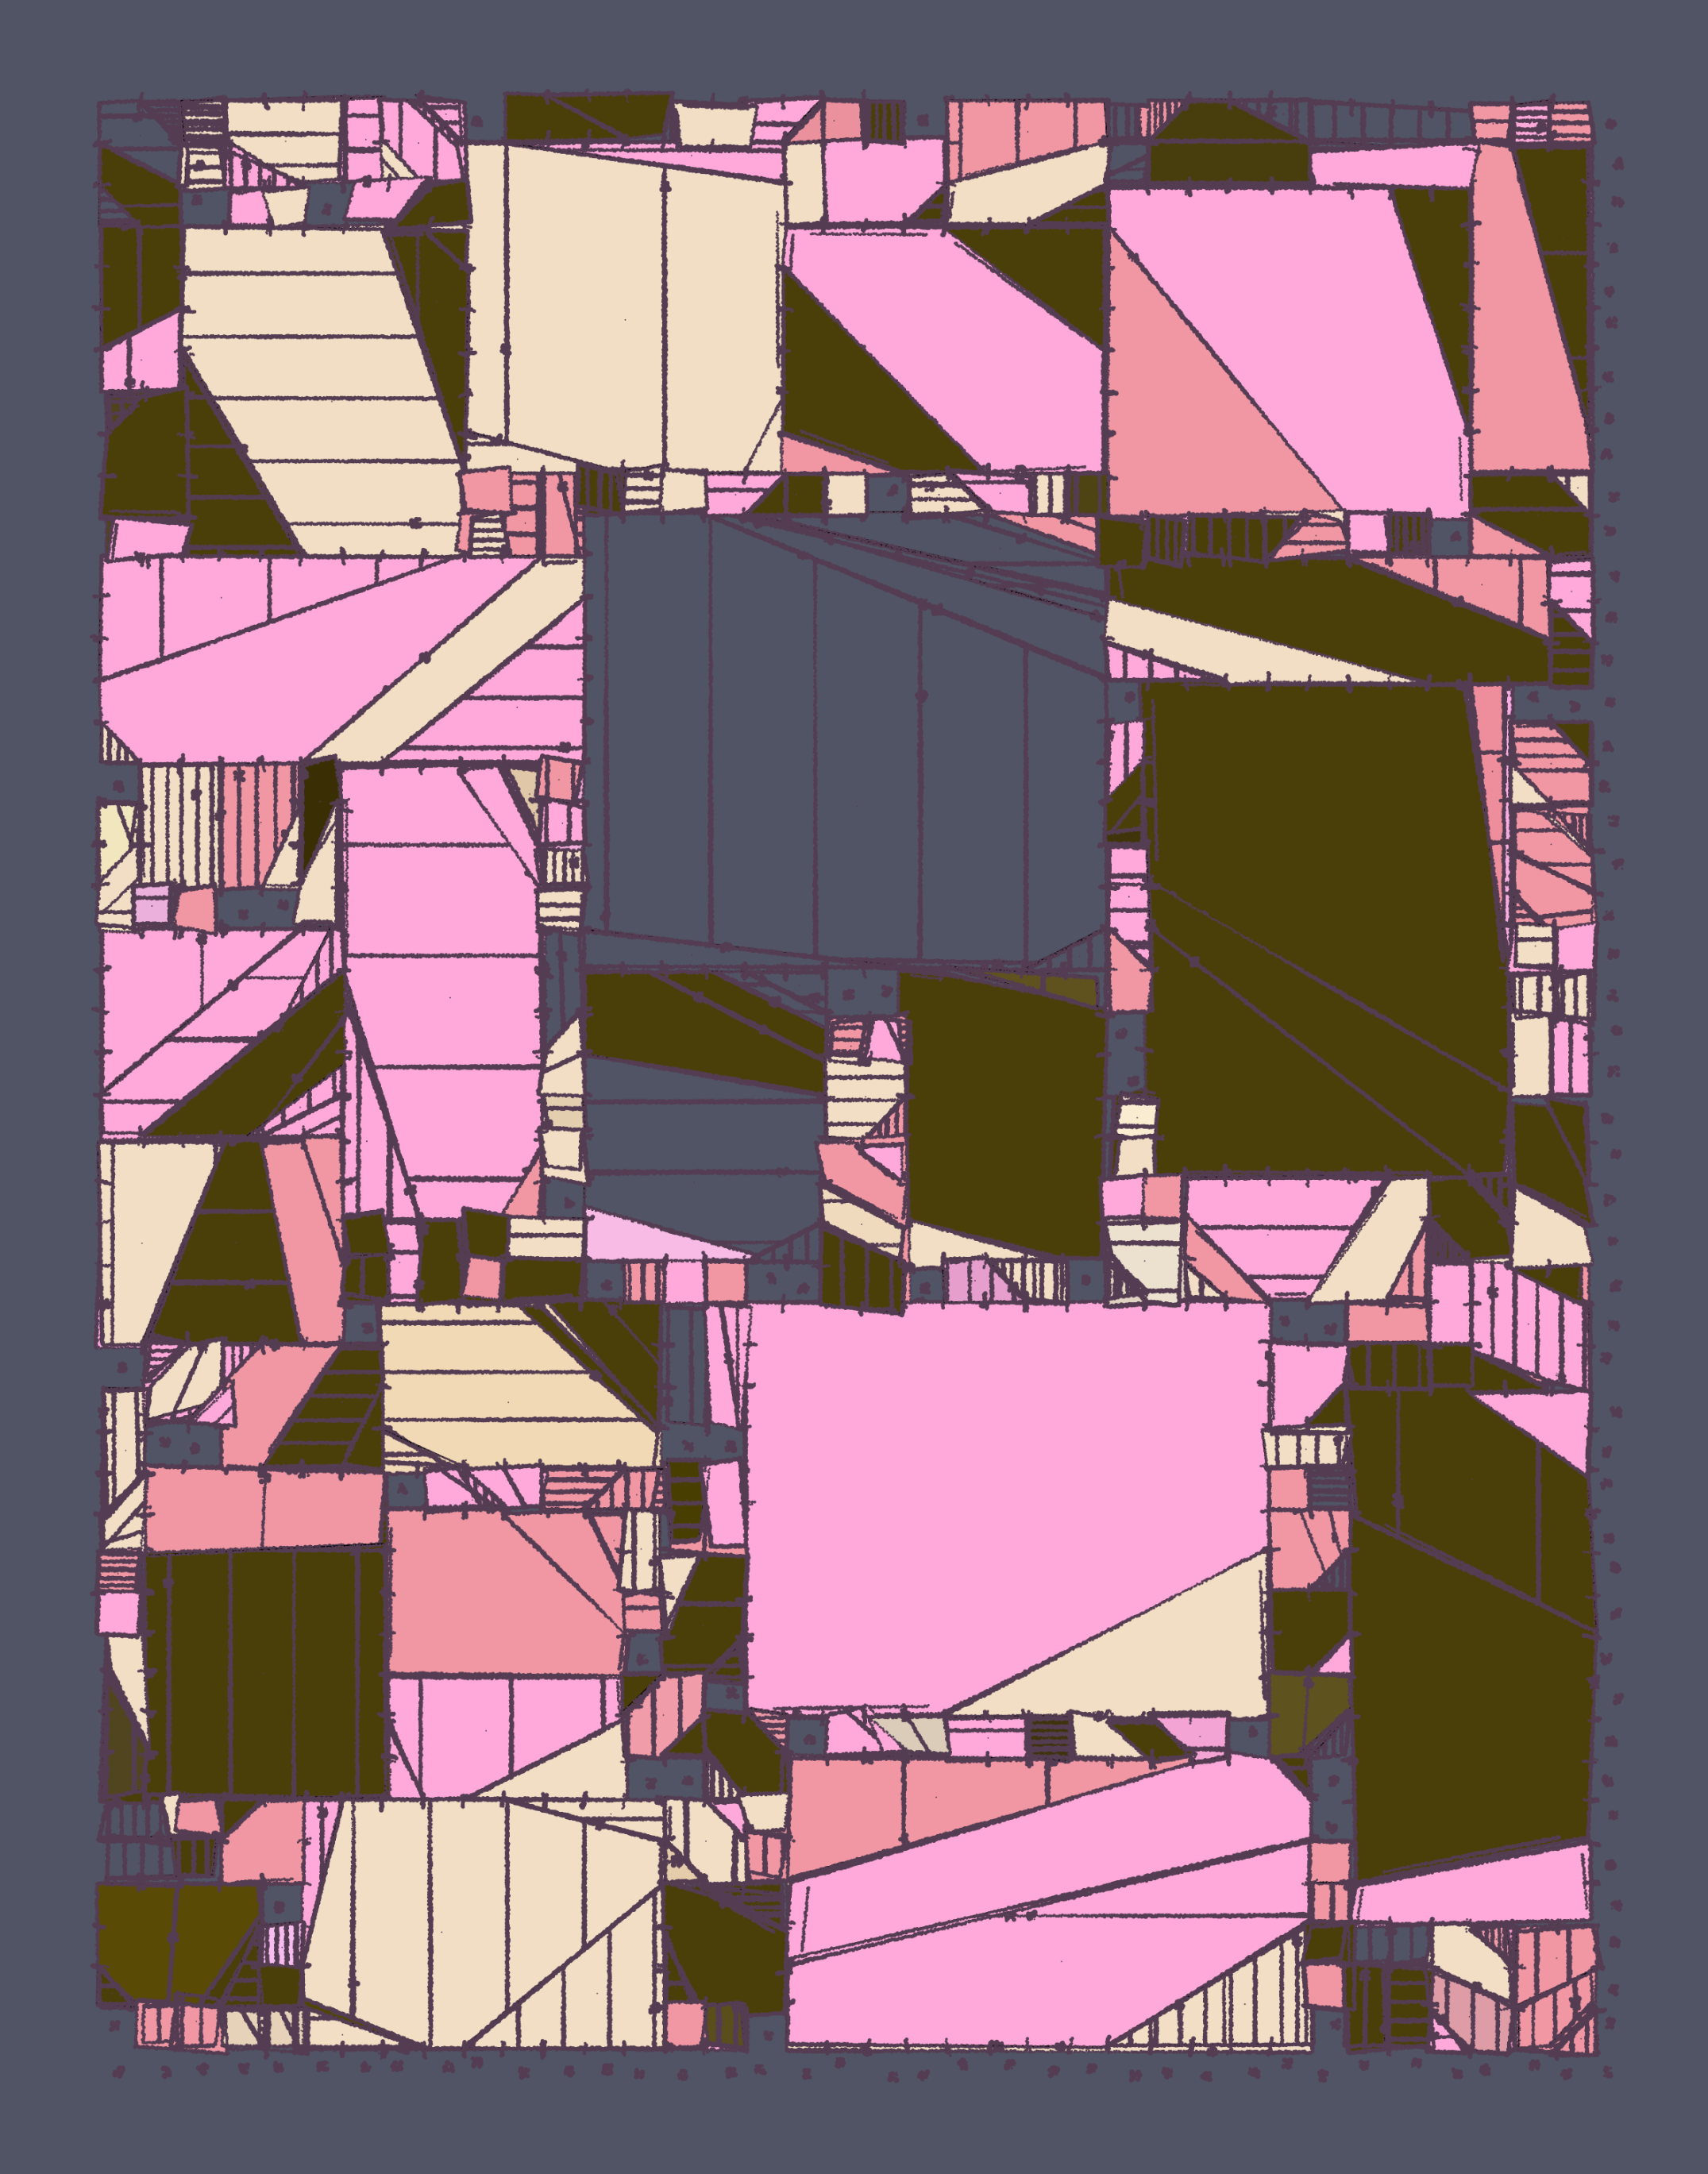
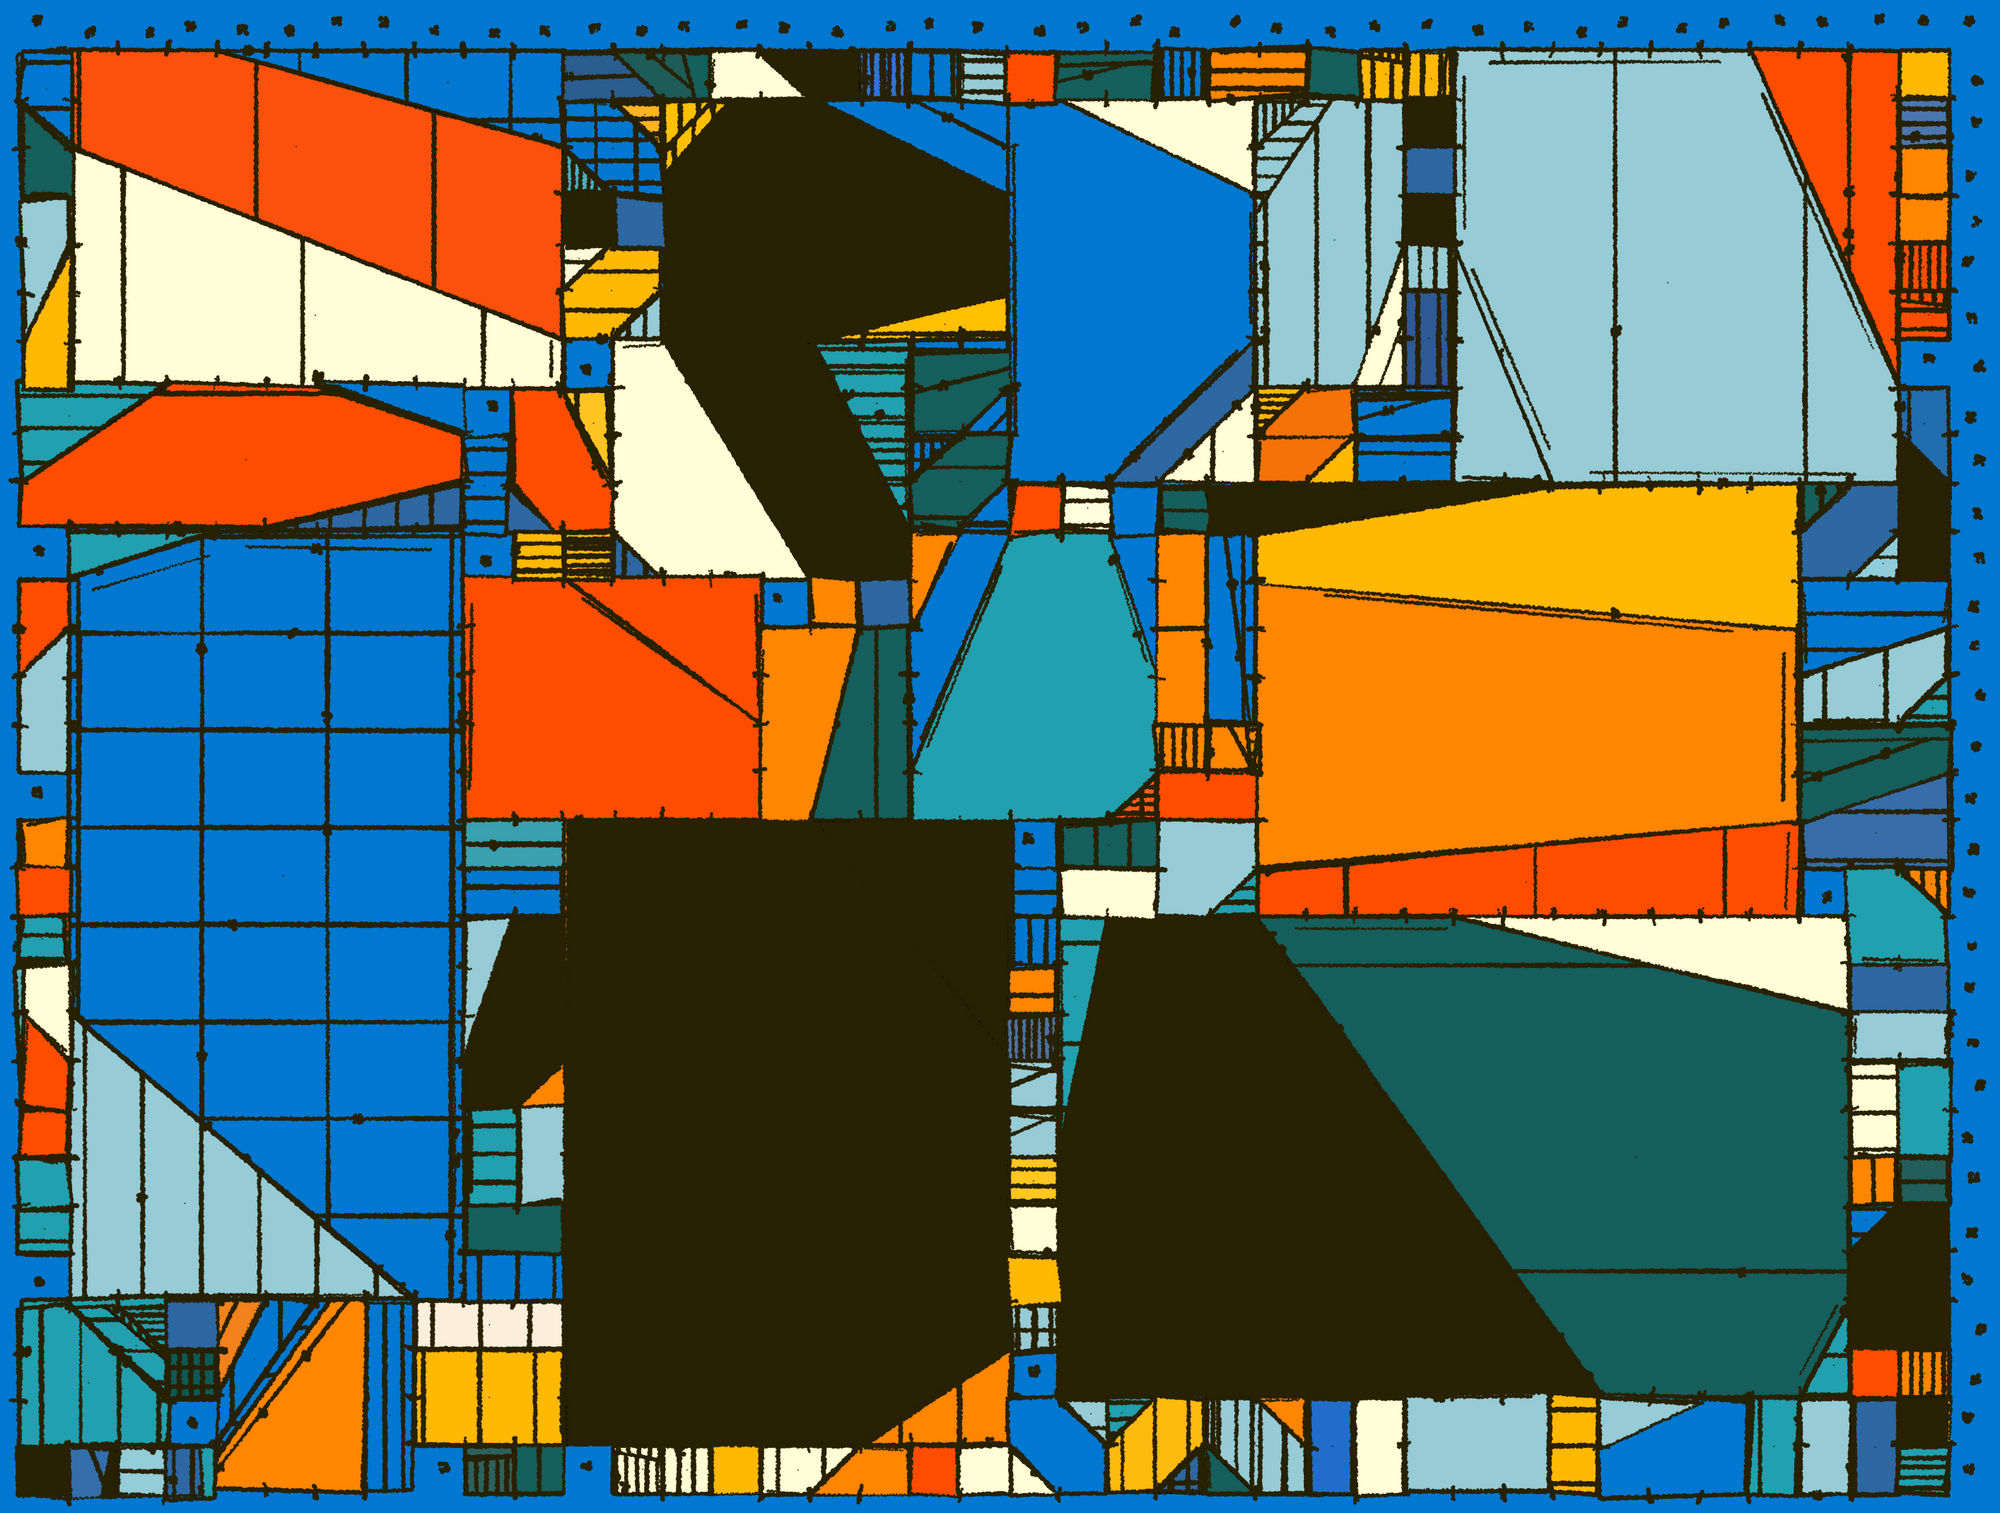
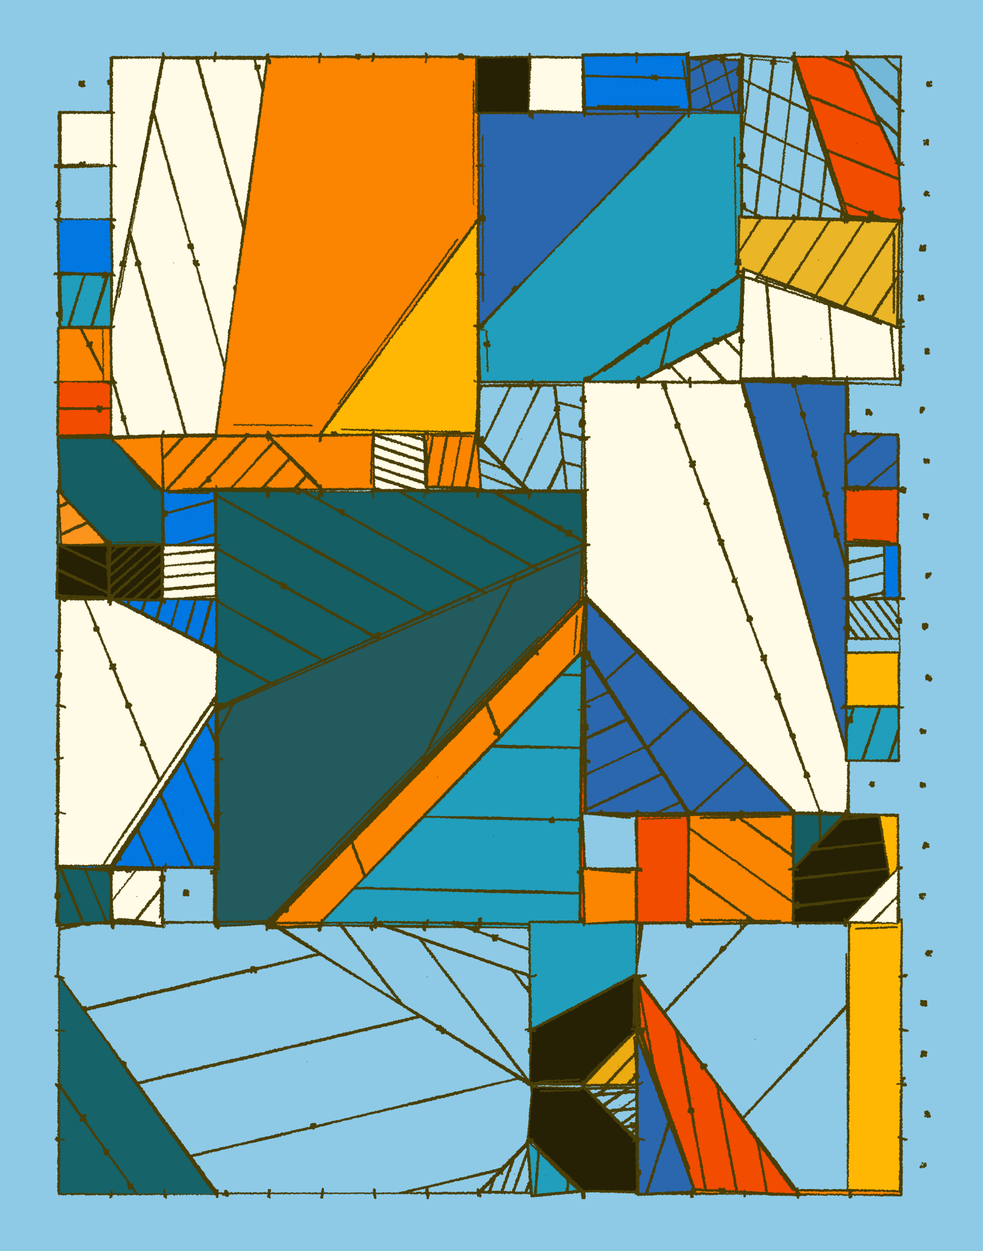
Selecting colors for this project was tough. But looking back I think I found some nice palettes that work well for the different compositions.
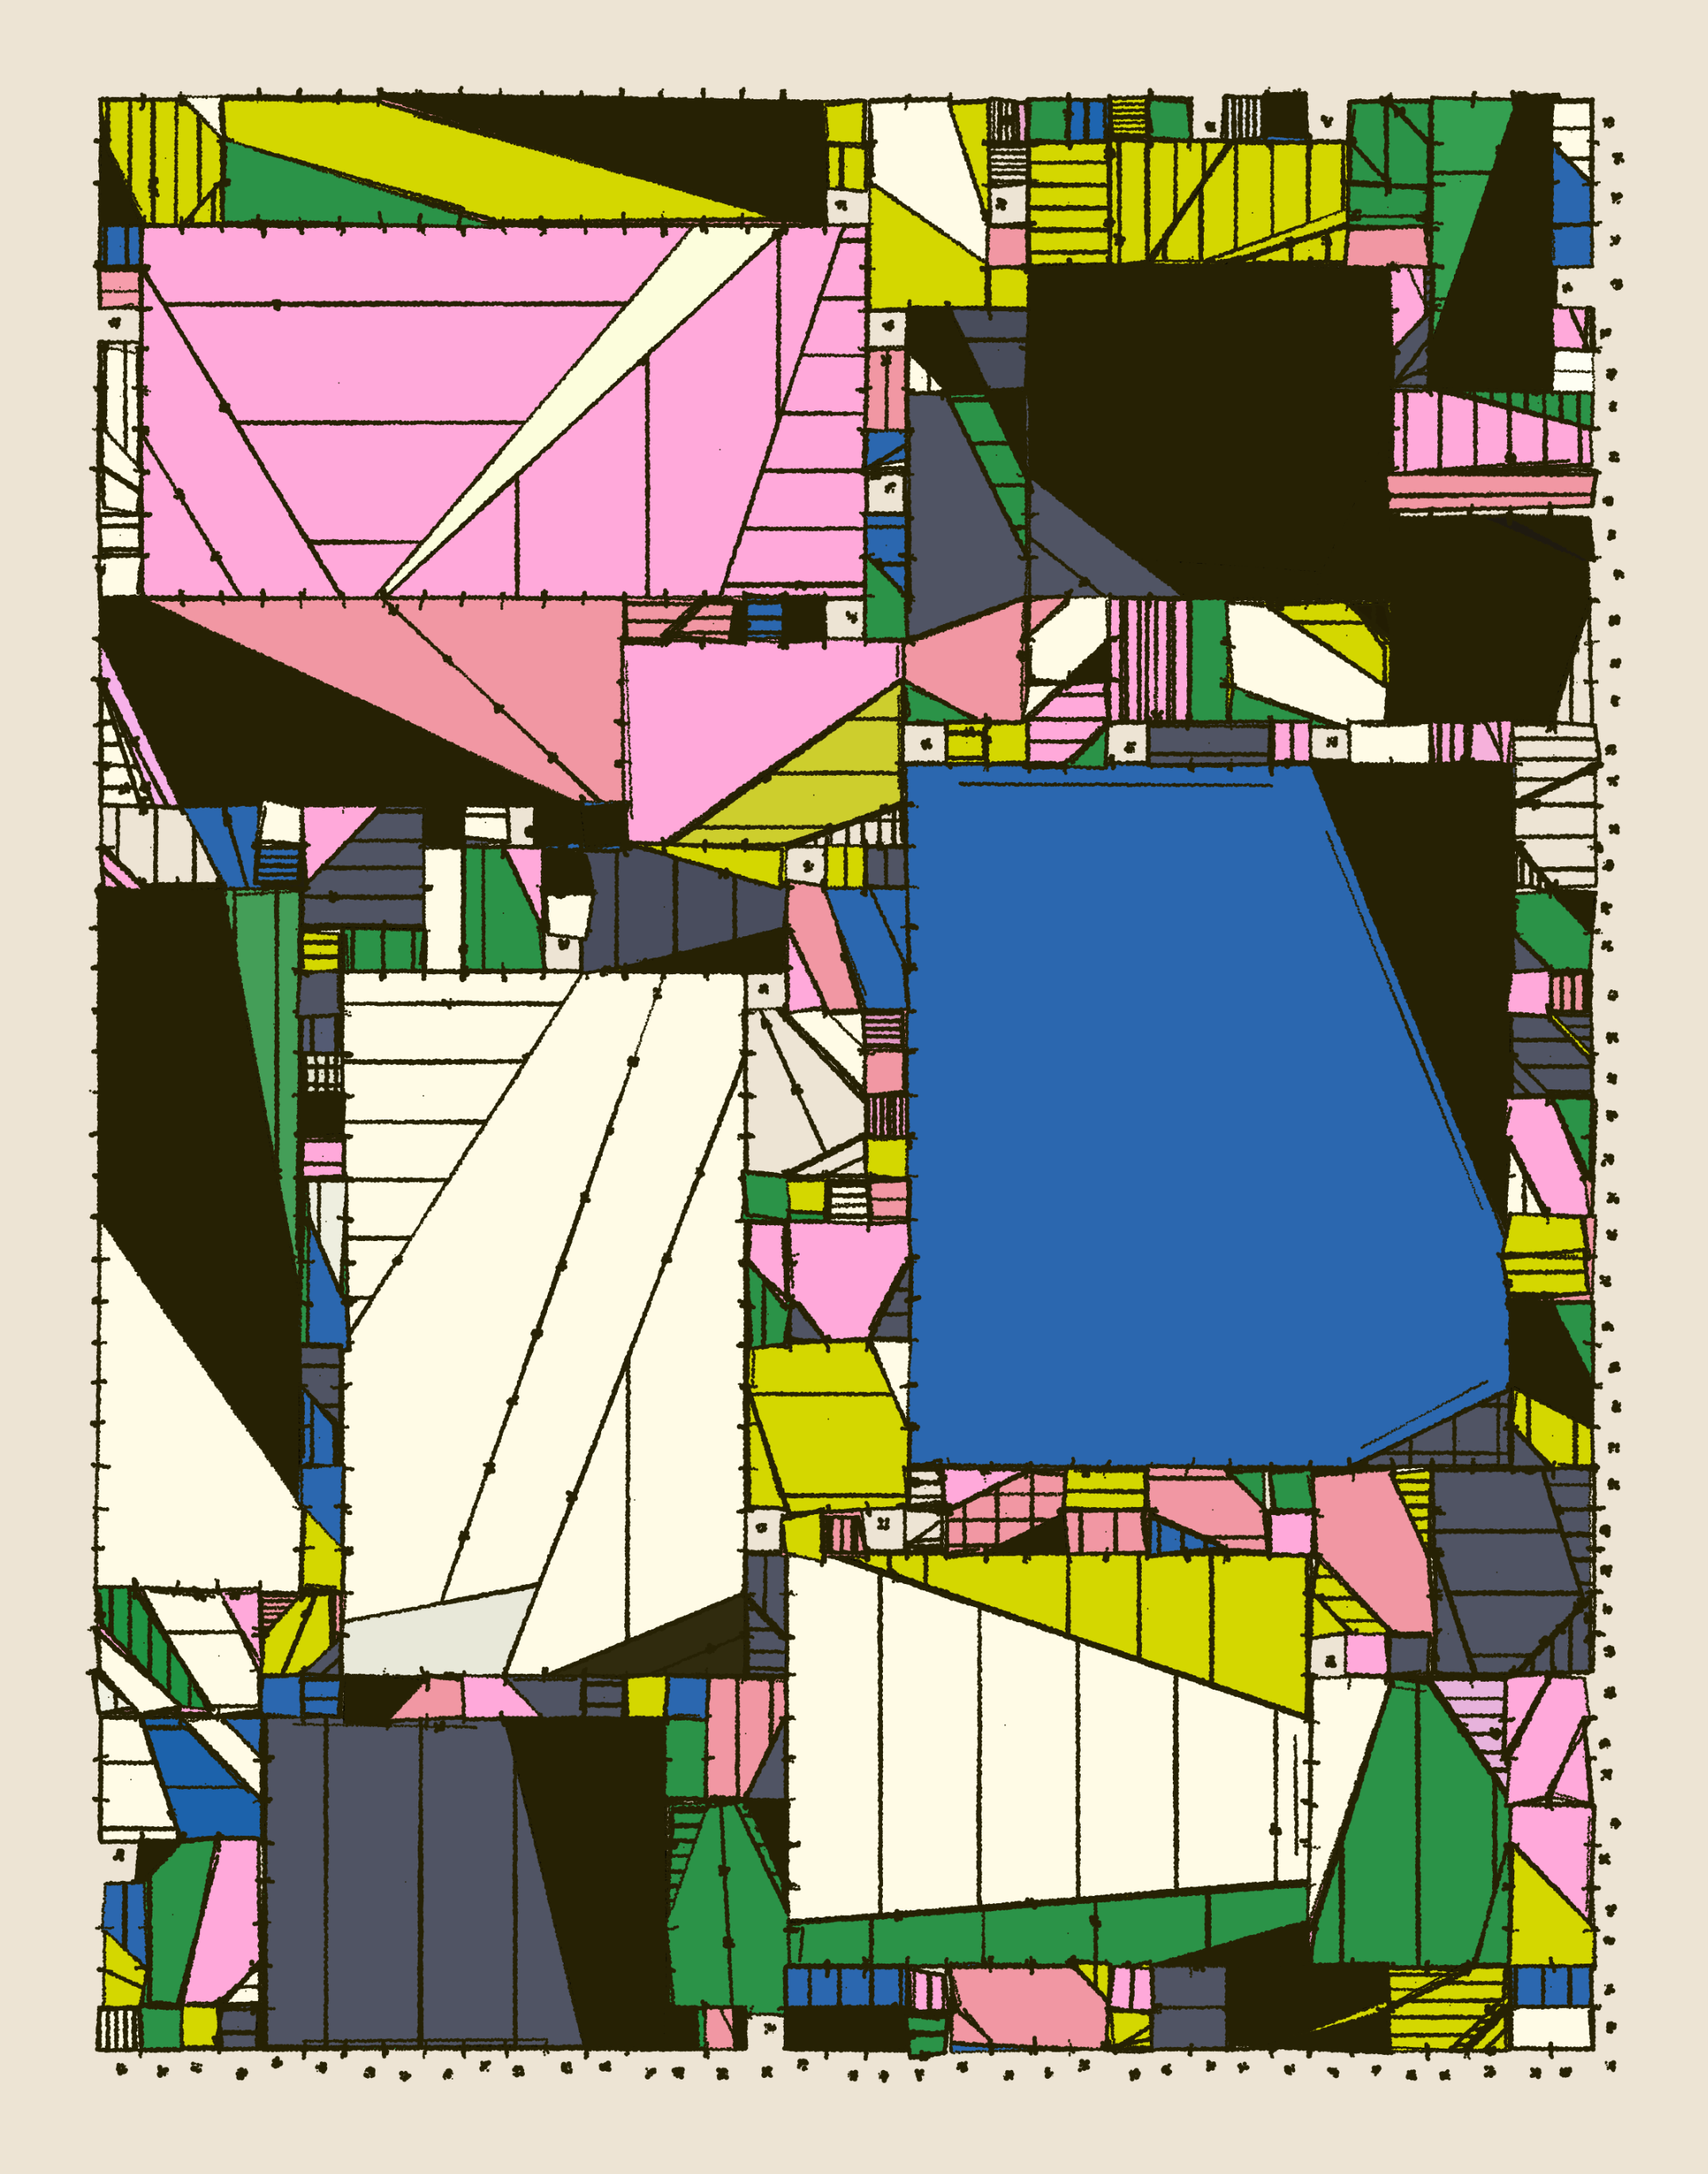
Grids can also be densely packed by selecting a larger grid scale via one of the fxparams sliders.
Closing Thoughts
It was an honor to have my piece displayed at Proof of X. In many ways it felt unreal to have a piece of mine somewhere so far away on such a big screen, and at the same time have people interact with it and tweak it's parameters.
I would have also loved to the try out the new live update feature that FxHash released just a few days prior to launch, but it don't think that the piece allowed for it anyway. I did however account for a fast and animated reload of the sketch whenever the parameters were updated by making use of Javascript generators. I also wrote about them here if you're interested in that:
Also huge thanks to all of the collectors that got an iteration of the publicly minting half! I'm planning on opening up the remaining iterations in the coming days, so if you haven't had a chance to get one yet 👇
And that's it for this article, I hope you enjoyed reading it as much as I enjoyed writing it ~ Cheers and happy sketching ~ Gorilla Sun 🌸