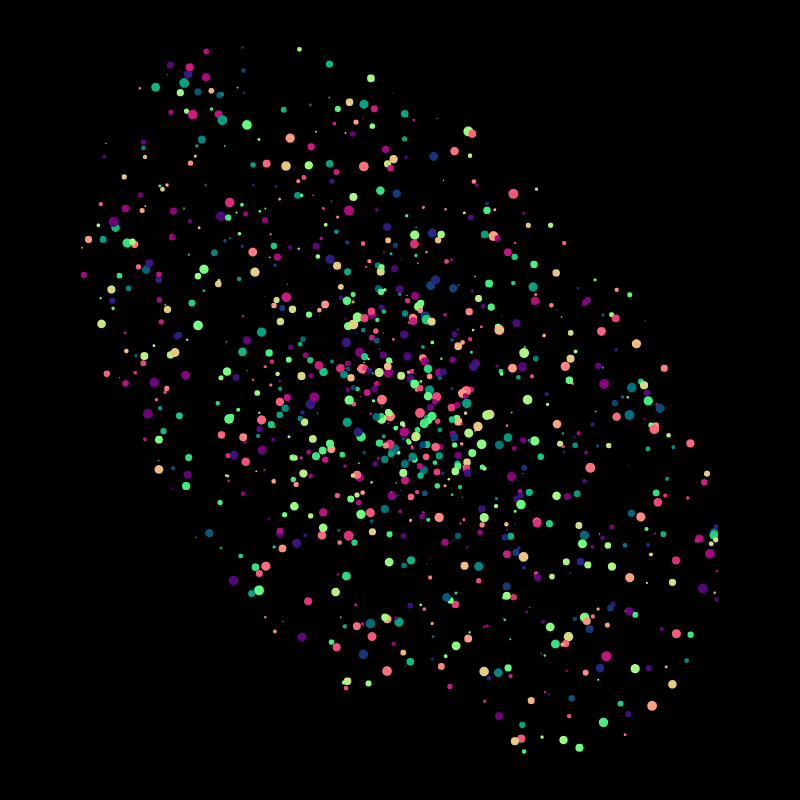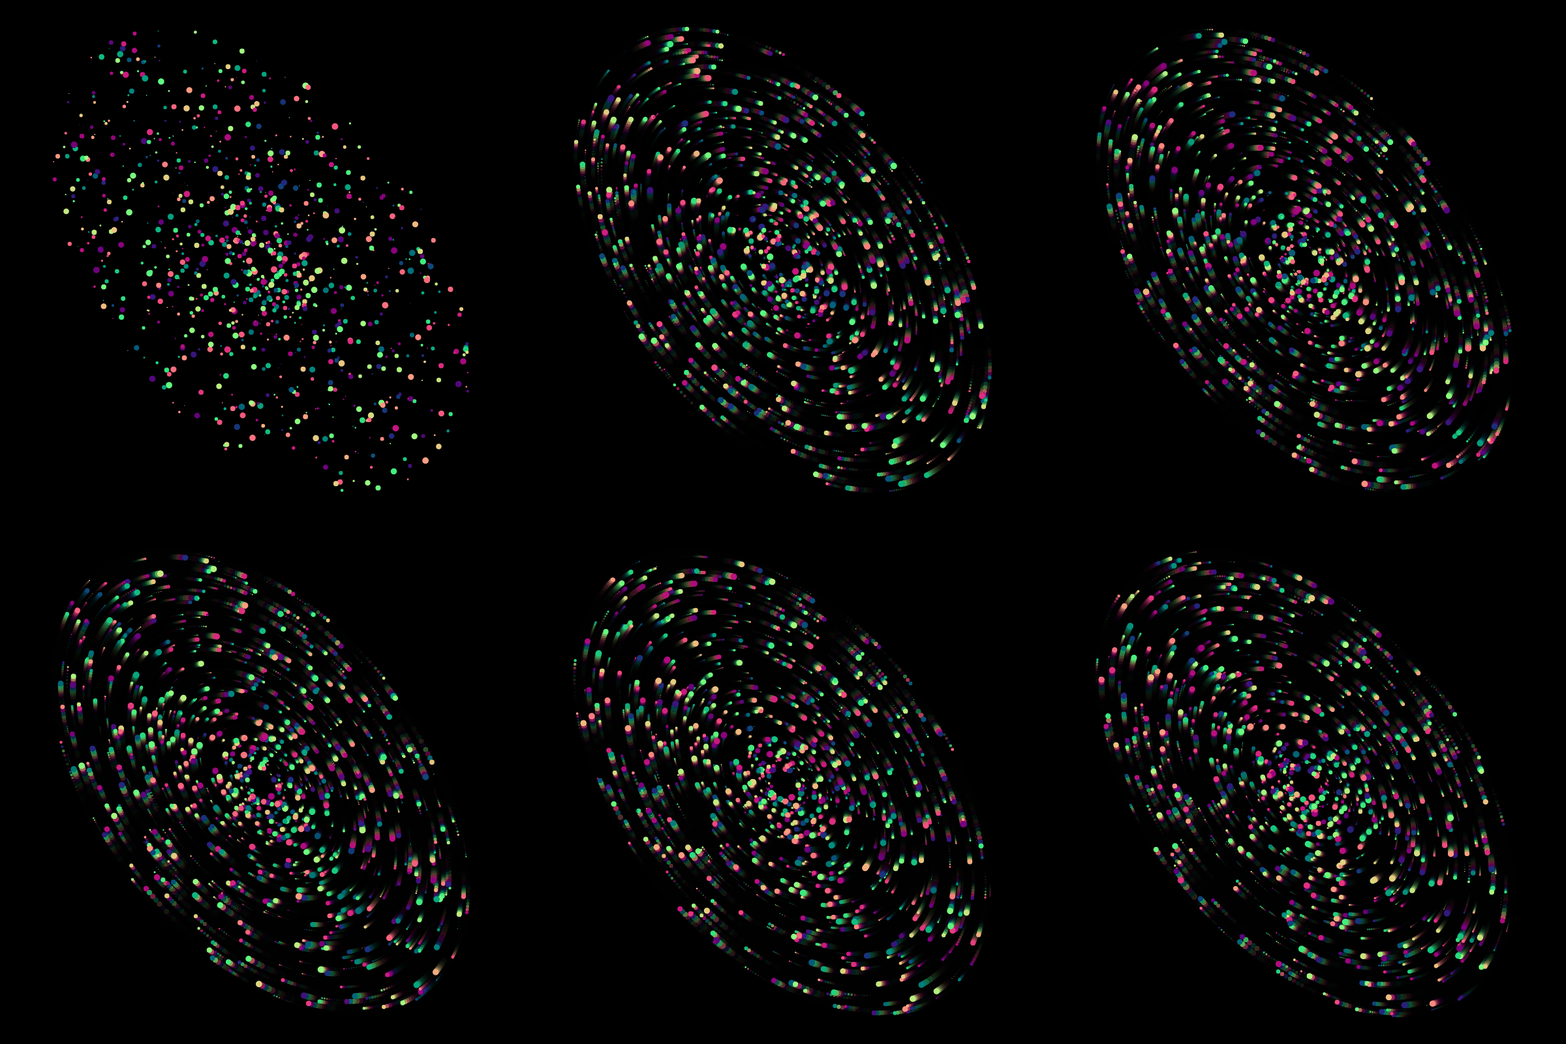
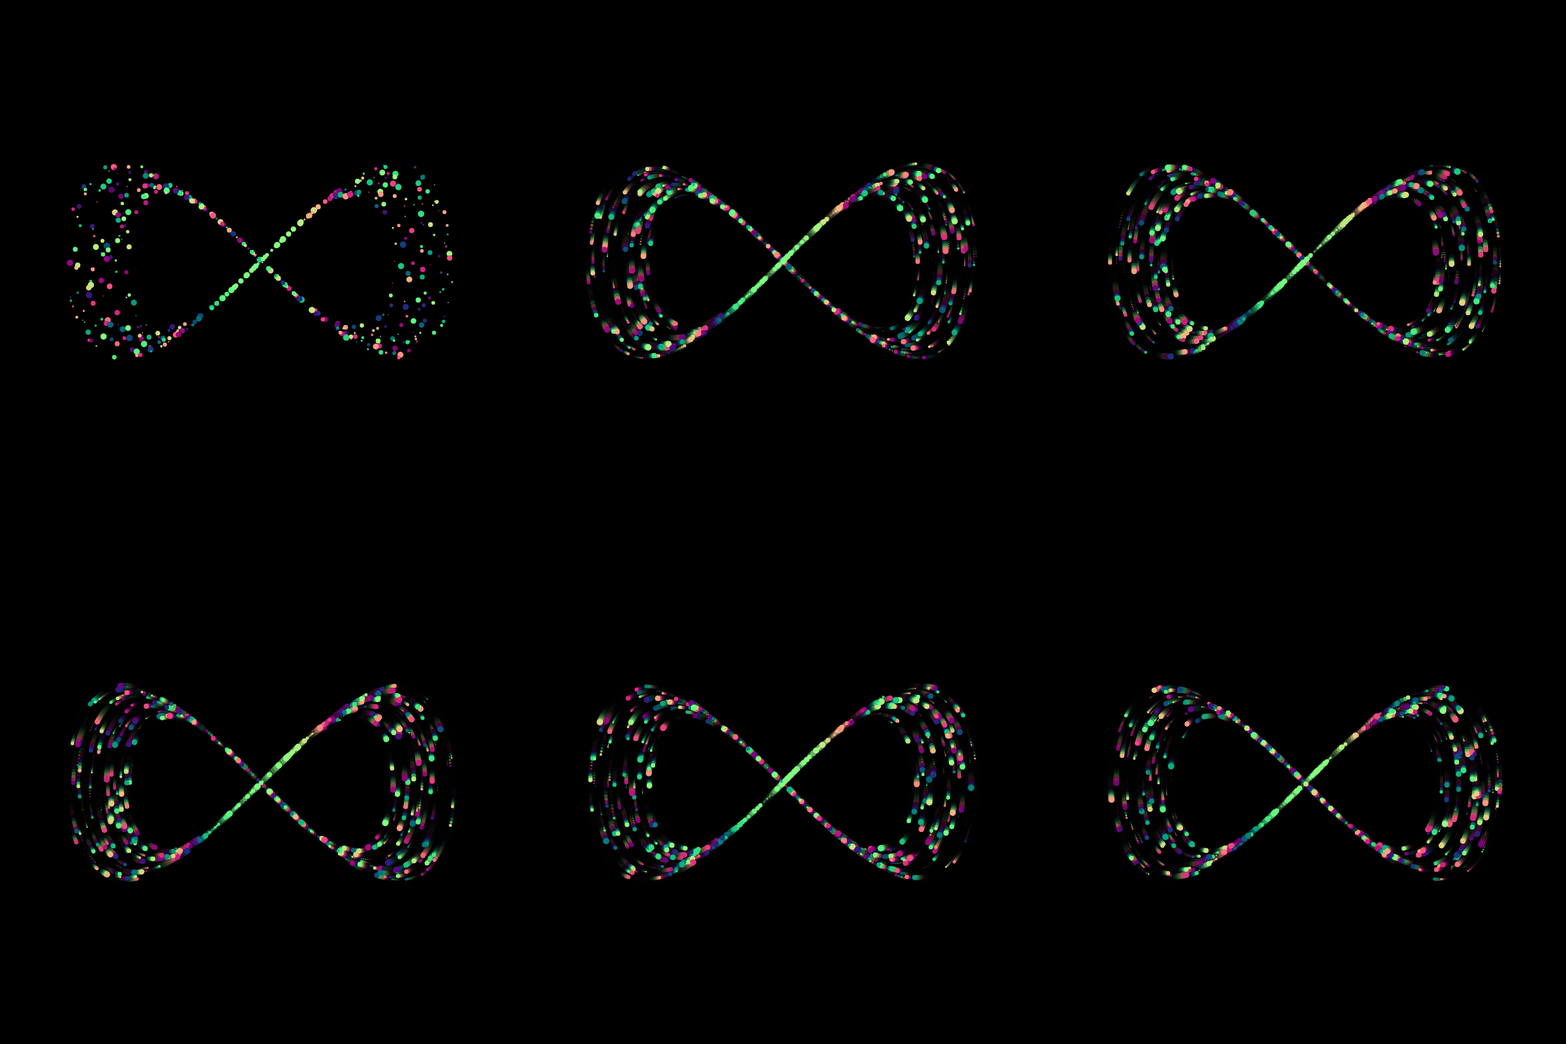
Creating shapes that are made out of small particles, has become an integral part of my sketches, and is something that can be easily combined with parametric functions. Constituting shapes out of smaller components looks visually very impressive, it gives things an almost organic feel, similar to nature where things are usually made out of smaller parts (fractals however, are topic for another day).
For our purposes, we'll start with a very simple exercise: drawing a circle to the canvas. In p5js, or alternatively processing, this is very simple. We are already provided with an inbuilt function for that: ellipse(x,y,size). Which will basically draw a circle at the specified x and y coordinates, and with a specific size.
Now, what if we want to draw a circle without this function, such that the circle is made up of many small points? As always, we can achieve this with a little trigonometry! Let's dive into the code!
Drawing a Circle... with many Points!
I have already shown this in my Generative Tree Rings post, but this trick has become pretty much standard in my toolkit, where we loop with a for loop from 0 to TAU:
numDivs = 20;
radius = 100;

translate(width/2, height/2);
for(a = 0; a<TAU; a+=TAU/numDivs){
  x = radius*cos(a);
  y = radius*sin(a);
  point(x, y);
}

Here we're incrementing from 0 to TAU by a specific number of chunks, which we can conveniently specify with the numDivs parameter. I like designating the loop variable with the letter a, standing for 'angle'. If you need a little refresher on trigonometry, fret not, I got you covered with one of my previous posts. Here the x and y coordinates of the point on the circle can be determined with the sin() and cos() functions, to which we will give the angle as input. Since the angle is incremented in chunks, we'll get a number of points equal to the numDivs paramter, that are equally distributed around the circle. Try it for yourself and change the numDivs parameter!
Neat, but still looks quite boring. Visually there is nothing interesting about it, even if we crank up the number of points. What we could do, is randomize the size of the points that make up the circle:
numDivs = 20;
radius = 100;

translate(width/2, height/2);
for(a = 0; a<TAU; a+=TAU/numDivs){
  x = radius*cos(a);
  y = radius*sin(a);
  strokeWeight(random(5));
  point(x, y);
}
Without the noLoop() statement this doesn't work very well, the dots just keep flickering spastically. We could determine a random size for each dot prior to drawing them and store that information somehow. We can do this in the setup function:
function setup(){
  createCanvas(400, 400);
  numDivs = 20;
  radius = 100;

  sizes = []
  for(a = 0; a<TAU; a+=TAU/numDivs){
    sizes.push(random(0.5,5))
  }
}
This is pretty straightforward in javascript (a little bit trickier in processing/java). We basically use the same loop that we use for drawing the points and populate an array with random values. We'll use the array as follows in the draw loop:
function draw(){
  background(220);
  translate(width/2, height/2);

  for(n = 0; n<numDivs; n++){
    a = TAU/numDivs * n
    x = radius*cos(a);
    y = radius*sin(a);

    strokeWeight(sizes[n]);
    point(x, y);
  }
}
Here we need to make a little modification to the for loop, where we iterate from 0 to numDivs and calculate the angle inside the loop. Then before drawing the point we can access the array with n. This will ensure that we always get the same strokeWeight for each point. We obtain something like this:
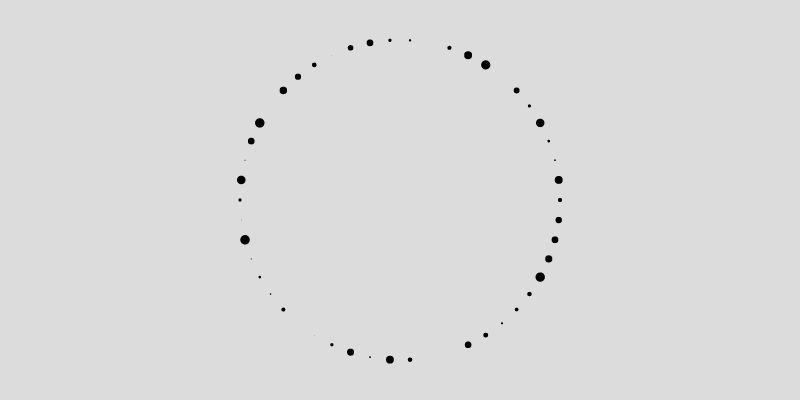
Now crank up the number of points to something like 500. This gives a really nice effect, where the circle almost looks like it's drawn with ink:
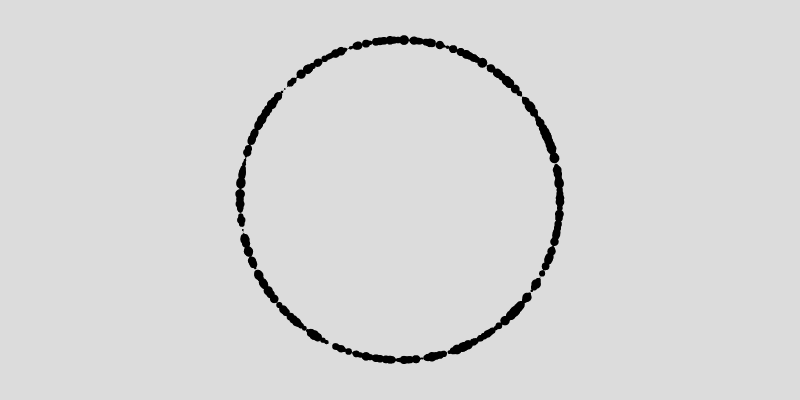
Adding Motion
Obviously there's a lot more that we can do to make this more interesting. We could let those points slowly rotate around the circle, such as in the following gif:
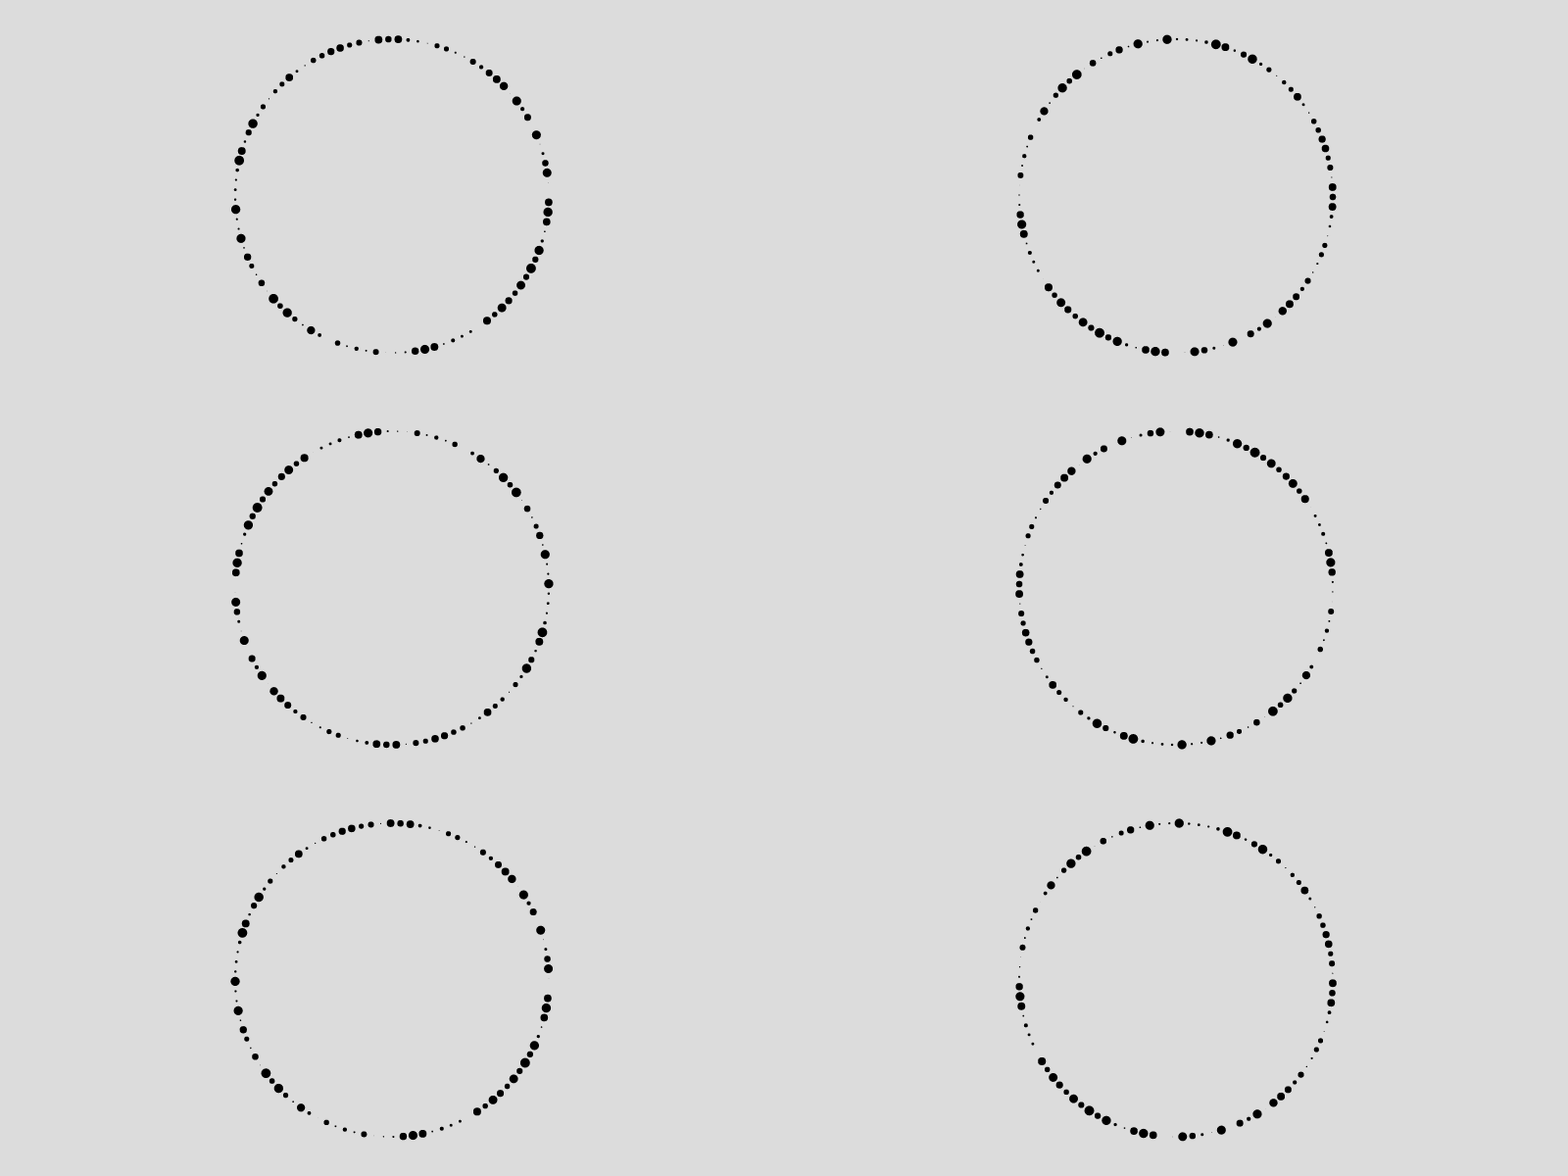
This requires a variable that is linearly increasing every draw loop, for which we have 3 options:
- Time since start of the sketch in milliseconds via the millis() function
- The number of frames since beginning of the sketch via the frameCount variable
- Our own variable that we increment every draw loop
The millis() function, as well as incrementing your own variable are useful for very smooth animations. However there is a little advantage to using frameCount instead: while rendering your GIF the progress of the animation will be dependent on the number of frames that have elapsed, and your sketch will be essentially baked into a GIF, regardless of stutters your machine/browser might have. Using the millis() function any rendering stutter or hiccup will be also baked into the final GIF.
Alrighty, frameCount it is, the code to animate the circle will then be:
function setup(){
  createCanvas(400,400)
  numDivs = 500;
  radius = 100;

  sizes = []
  for(a = 0; a<TAU; a+=TAU/numDivs){
    sizes.push(random(0.5,5))
  }

  FPS = 50;
  frameRate(FPS);
}

function draw(){
  background(220);
  translate(width/2, height/2);

  t = frameCount/FPS; //divide frameCount by FPS

  for(n = 0; n<numDivs; n++){

    // add t to angle and divide to slow down the movement
    a = TAU/numDivs * n + t/2
    x = radius*cos(a);
    y = radius*sin(a);

    strokeWeight(sizes[n]);

    point(x, y);
  }
}
We'll essentially store the frameCount divided by the the frameRate in a variable t (t for time), and add that variable to the angle of each point. This makes each point slowly rotate around the circle.
This is already more interesting than before, but it's still a little boring. All the points are moving at the same speed, it would be much more interesting to have each point move at it's own pace:
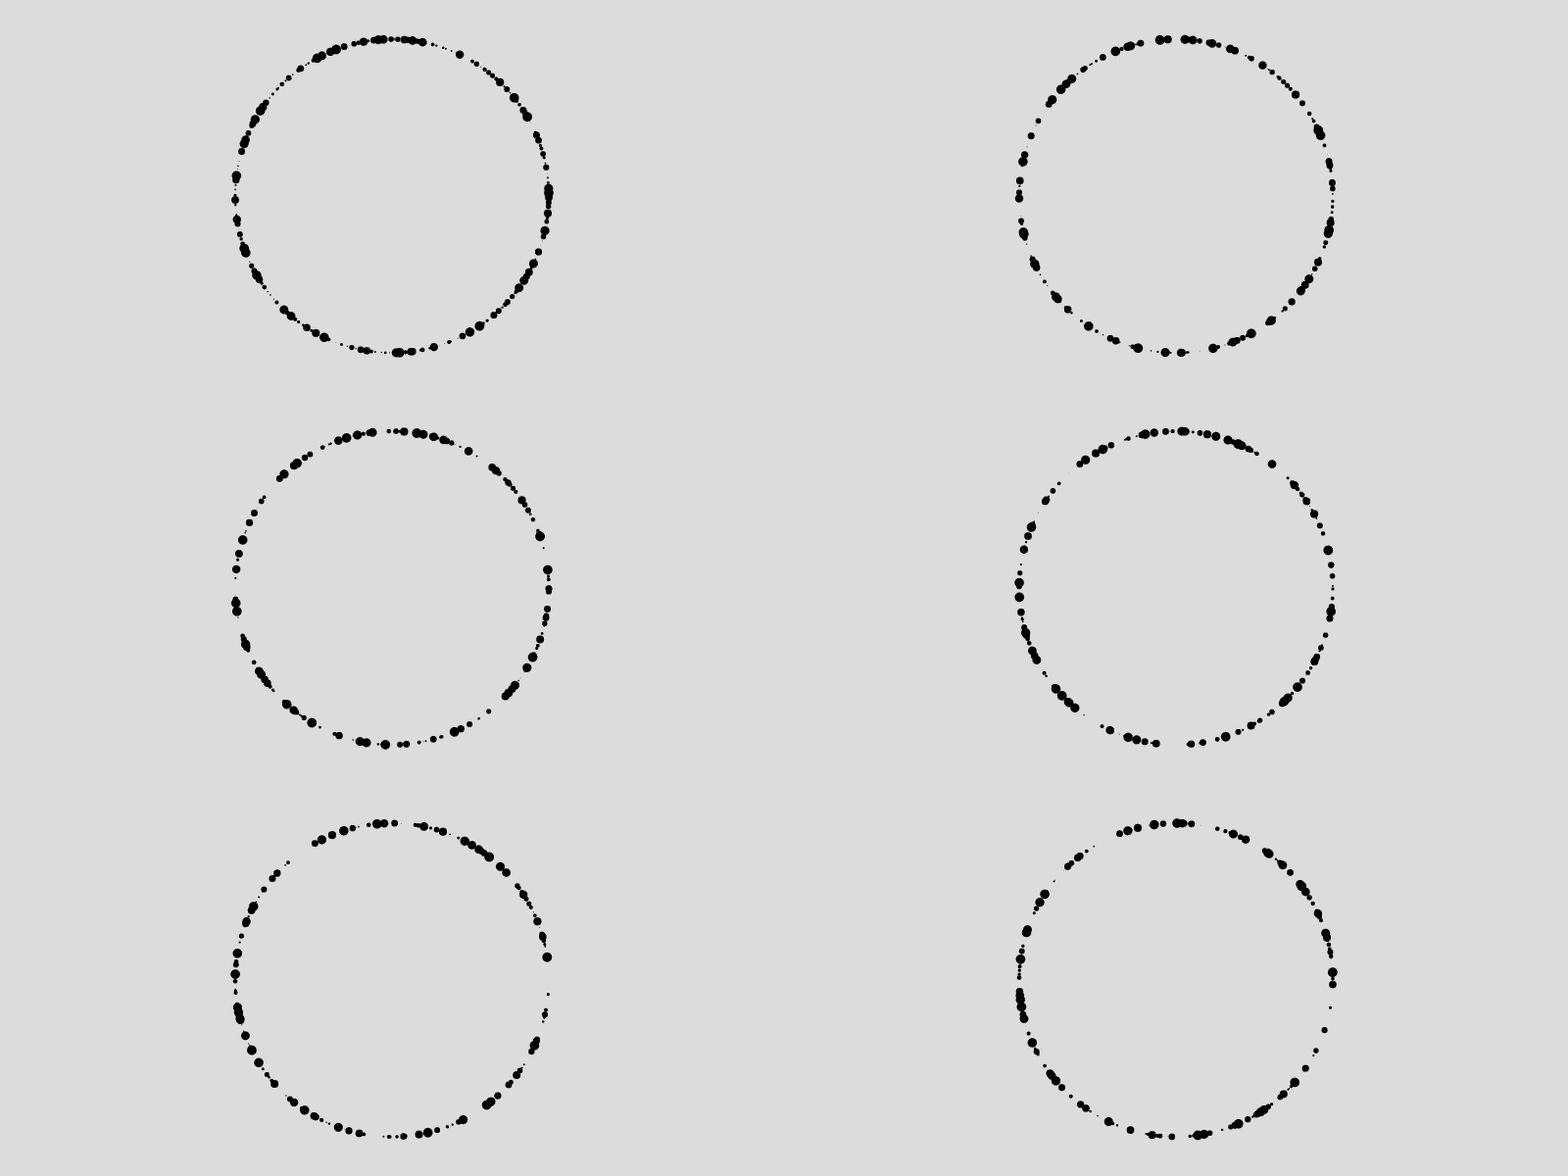
We can achieve this with another array that we fill in the setup function with different random numbers, and then divide the variable t by them. One downside of this is that it becomes much more difficult to make a perfect loop, but it looks already more interesting. Another thing we can do to make it look a little better, is vary the radius of each point slightly, such that they're not all moving on the same ring:
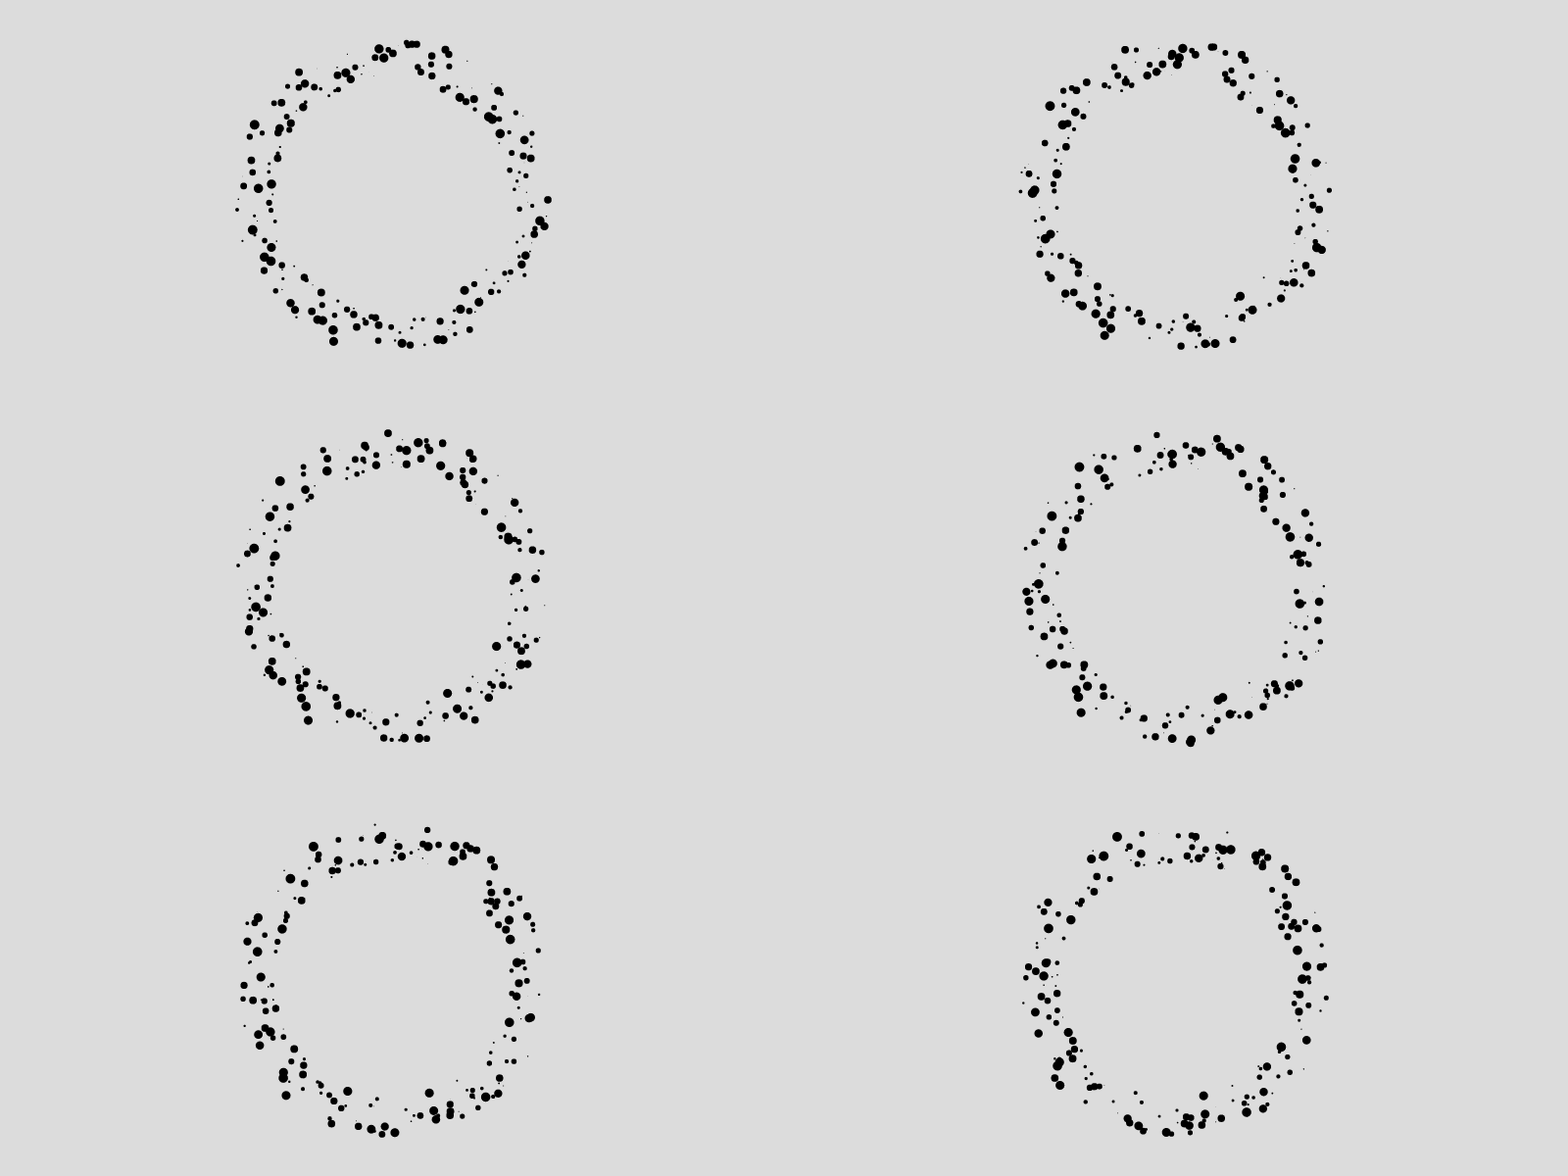
Parametric Functions
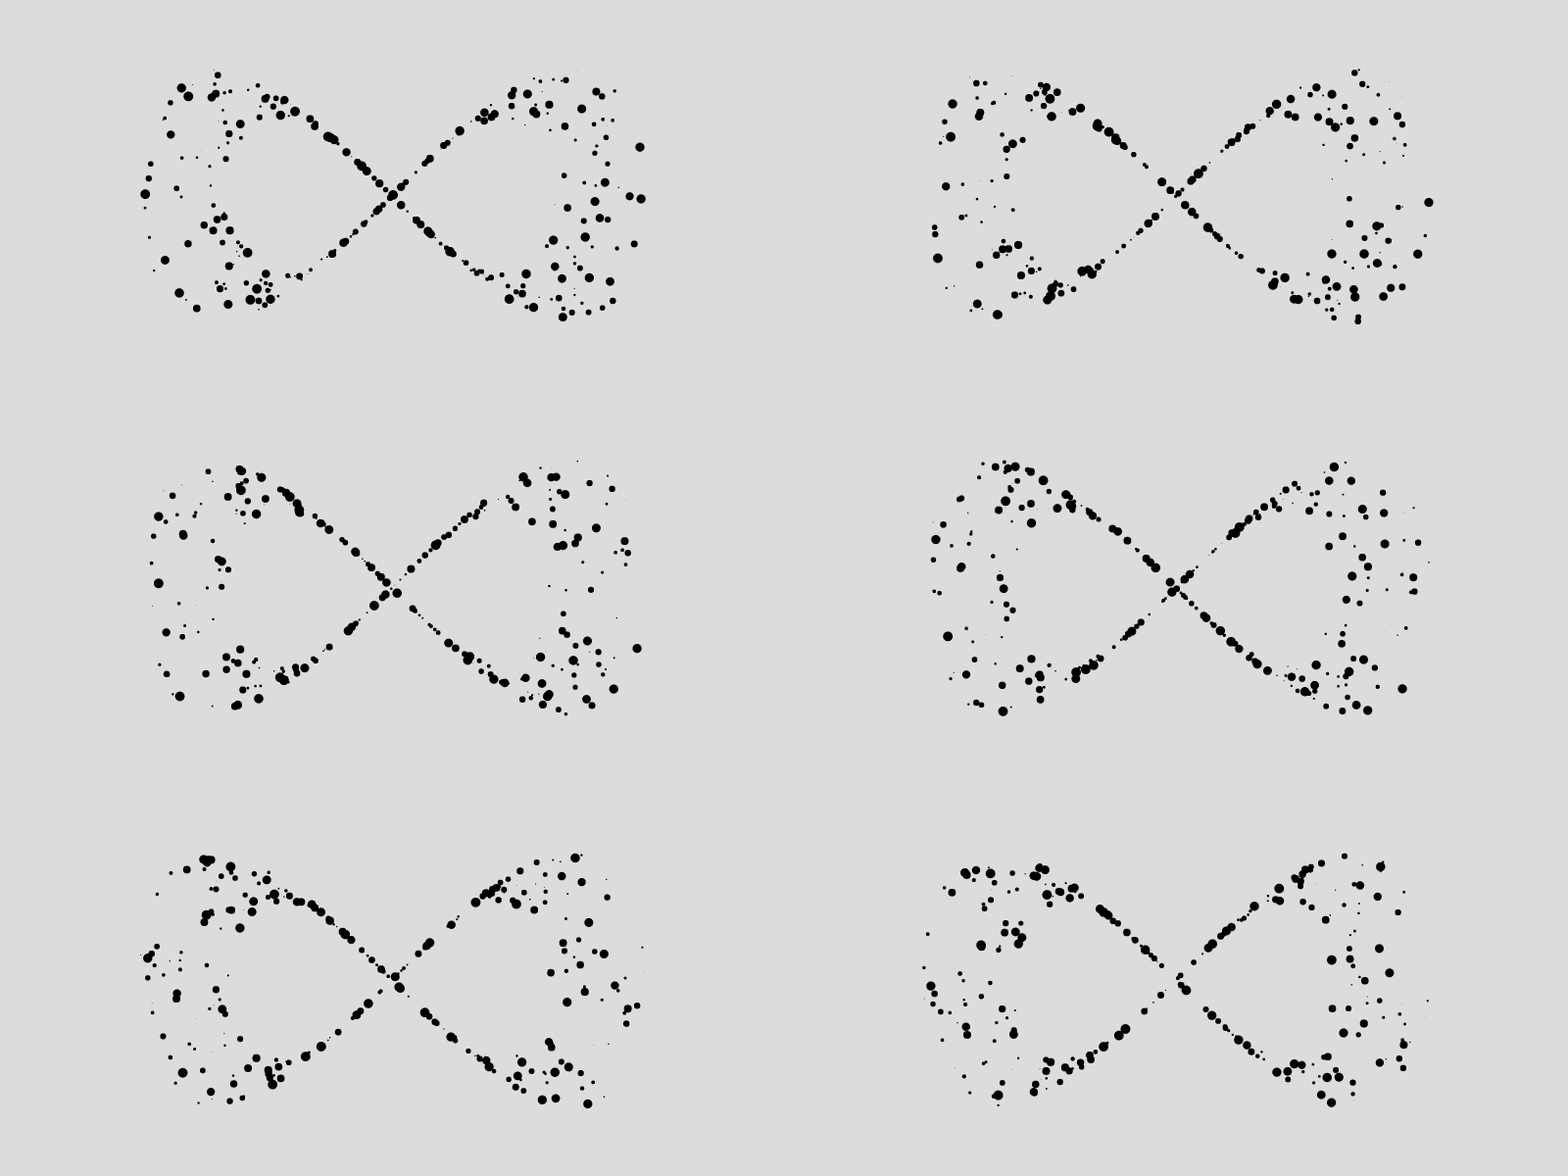
Next we can do, is play with the trigonometry that determines the position of the points, and plug in different parametric functions instead of the circle. For example we can modulate the y coordinates with another cosine function, such as in the following, and obtain the Lemniscate of Gerono, aka the infinity symbol:
x = r*cos(a);
y = r*sin(a)*cos(a);
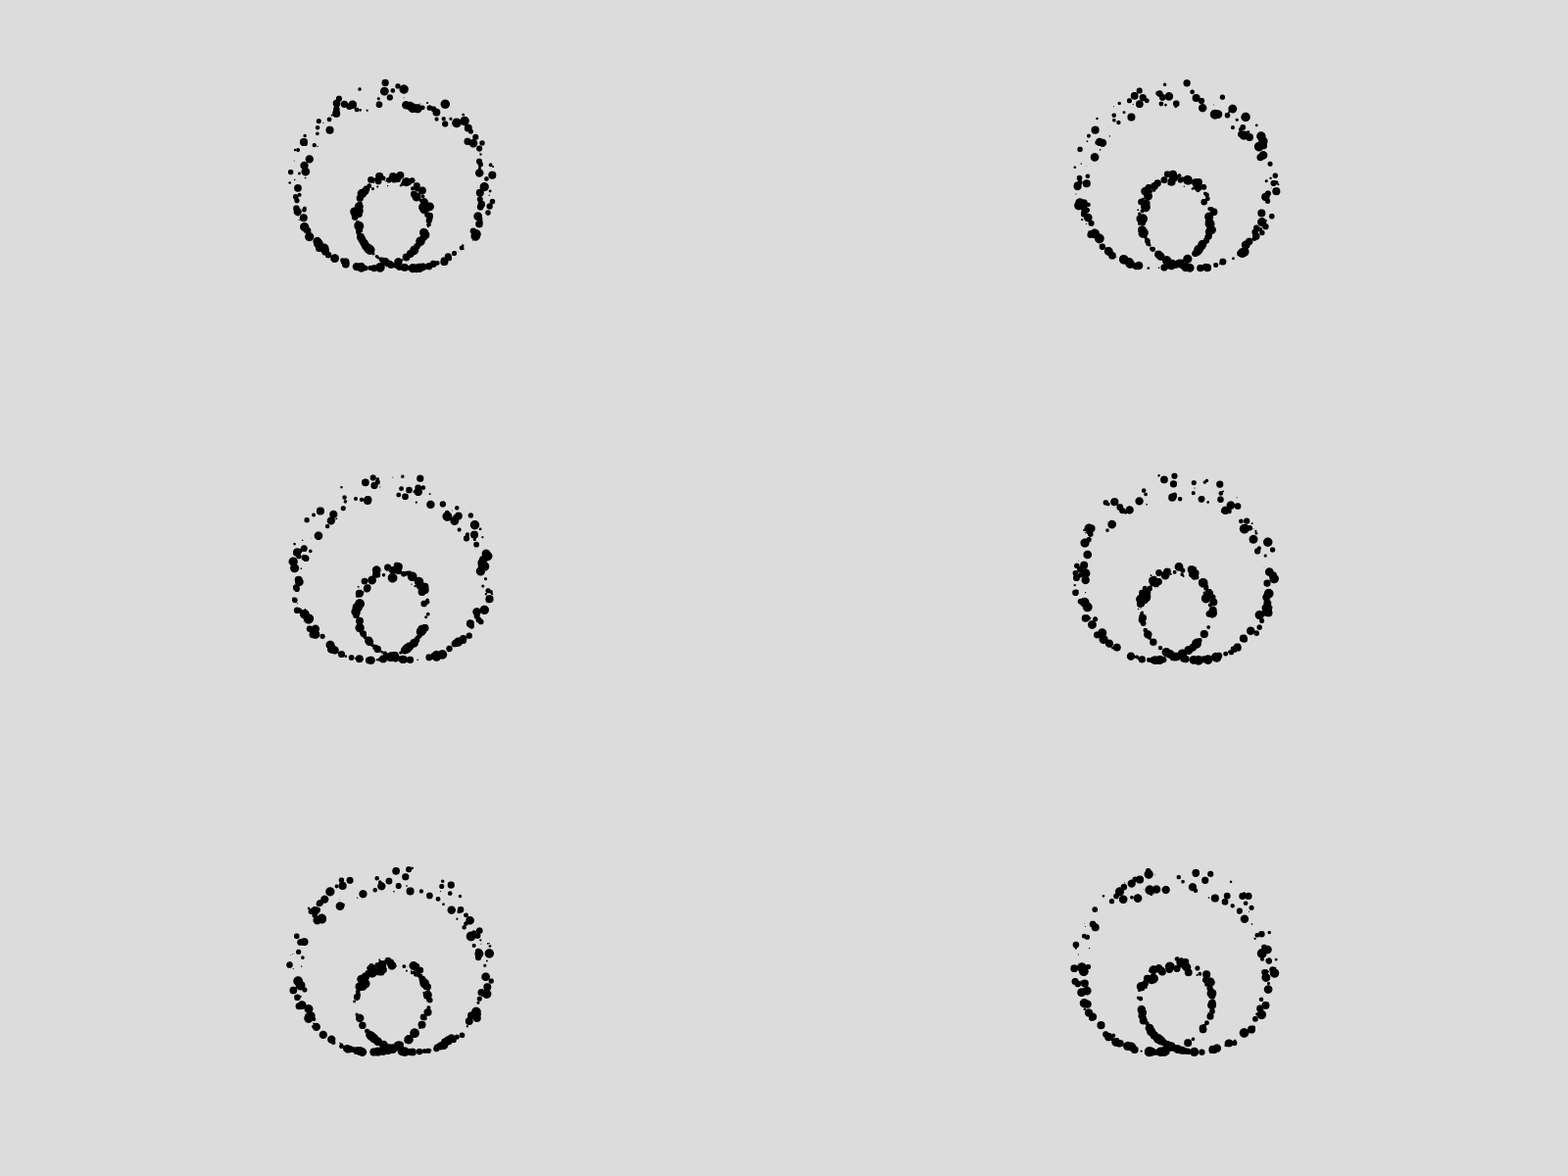
Or we could modulate the radius of the points with a sine function and obtain the function that specifies a Limacon:
a = TAU/numDivs * n + t/speed[n]
r = radius + radi[n]*20
r = (r*1/3 + r*sin(a)) // this line makes the magic happen
x = r*cos(a);
y = r*sin(a);
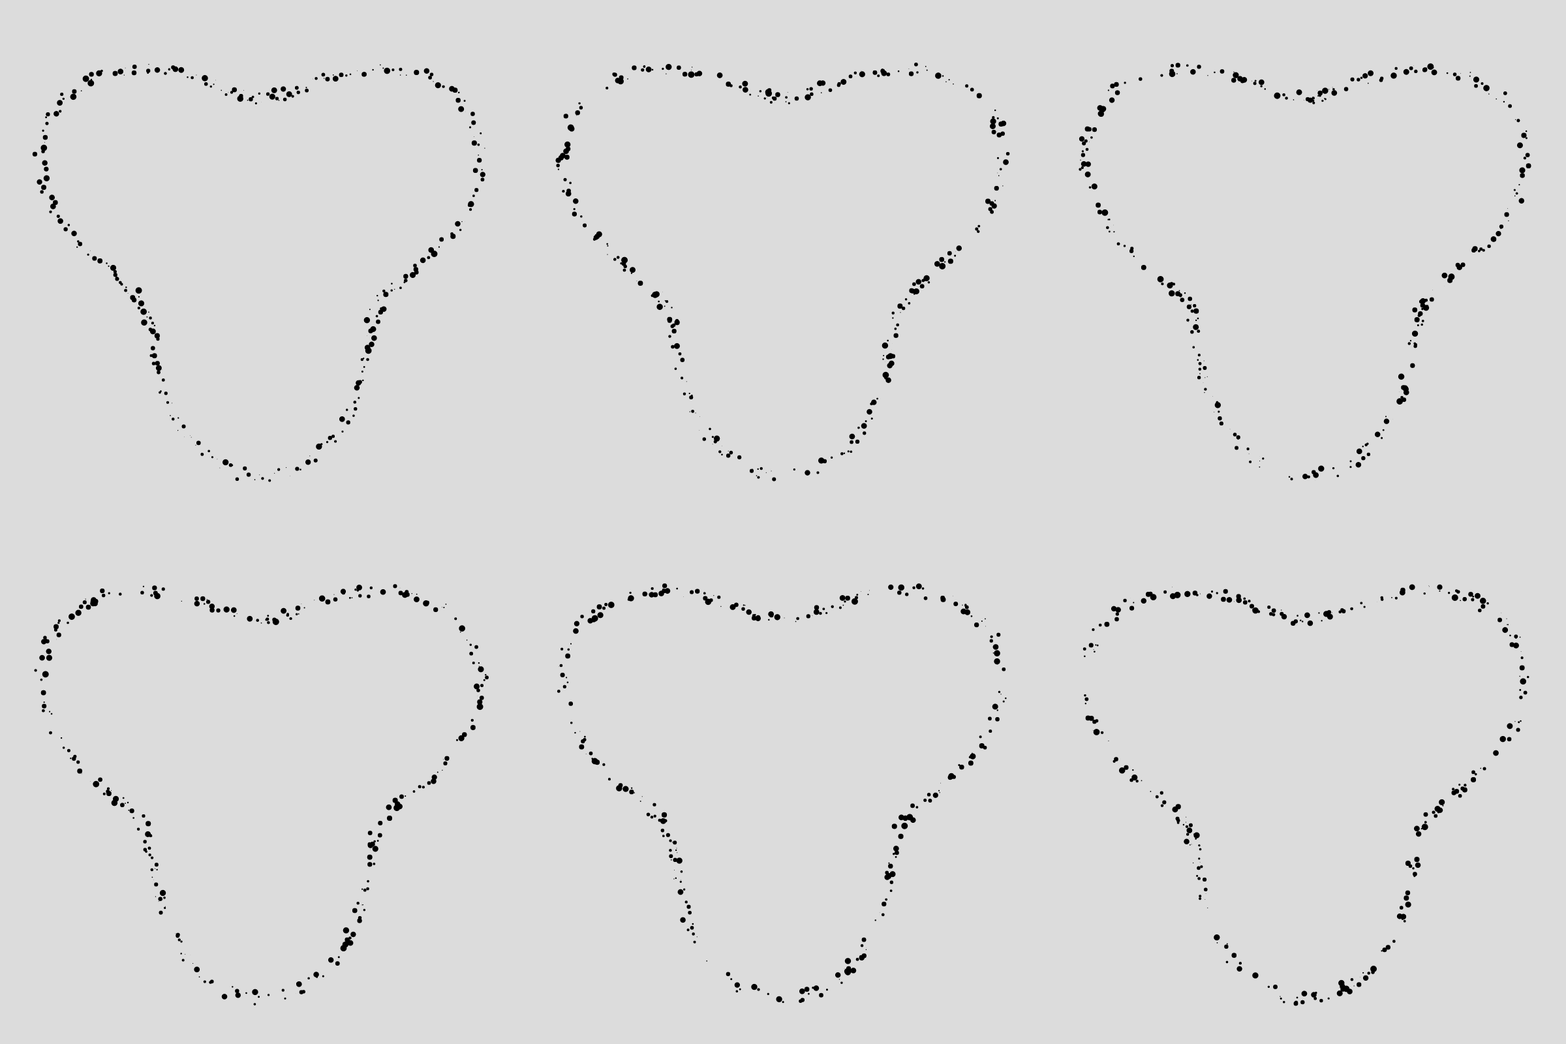
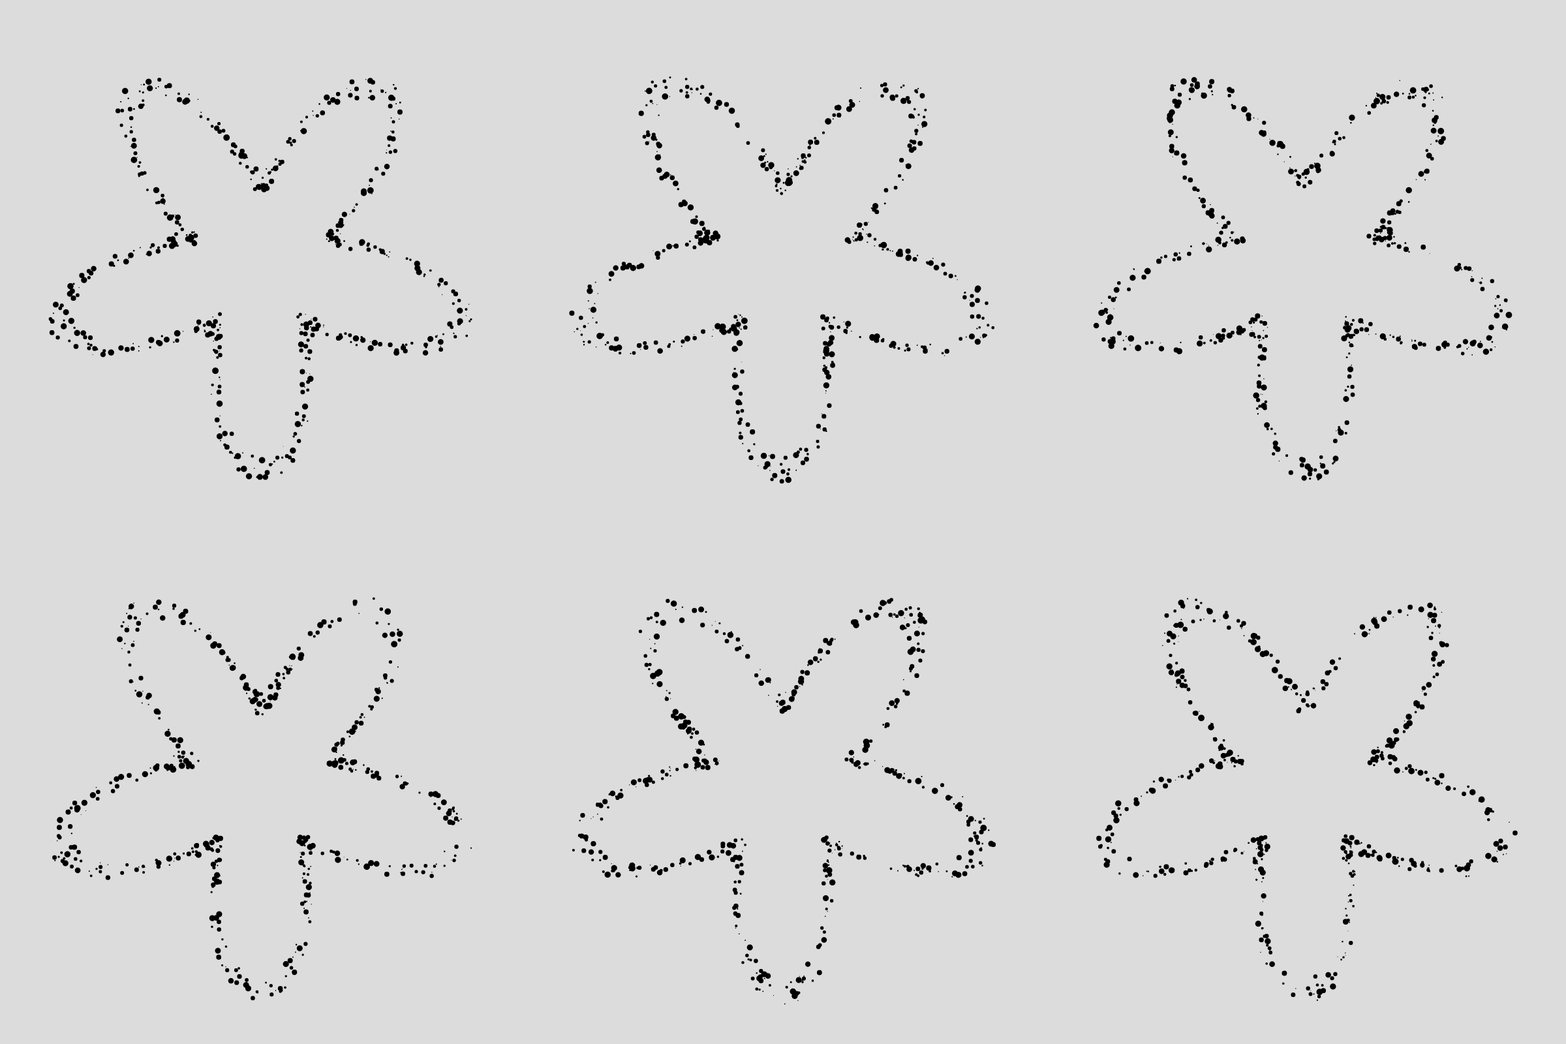
Or you could draw a flowers with an arbitrary number of petals, by modulating the radius of the points:
ratio = 3 //change number for different number of petals
r = radius + radi[n]*20 + 50*sin(a*ratio)
Making the animation smoother
A little trick to make the particles look a little better is making the background slightly transparent by setting it's alpha value to something less than 255. Depending on that value, it'll look as if there is a little bit of motion blur on the particles, giving them a trail:
background(220,50);
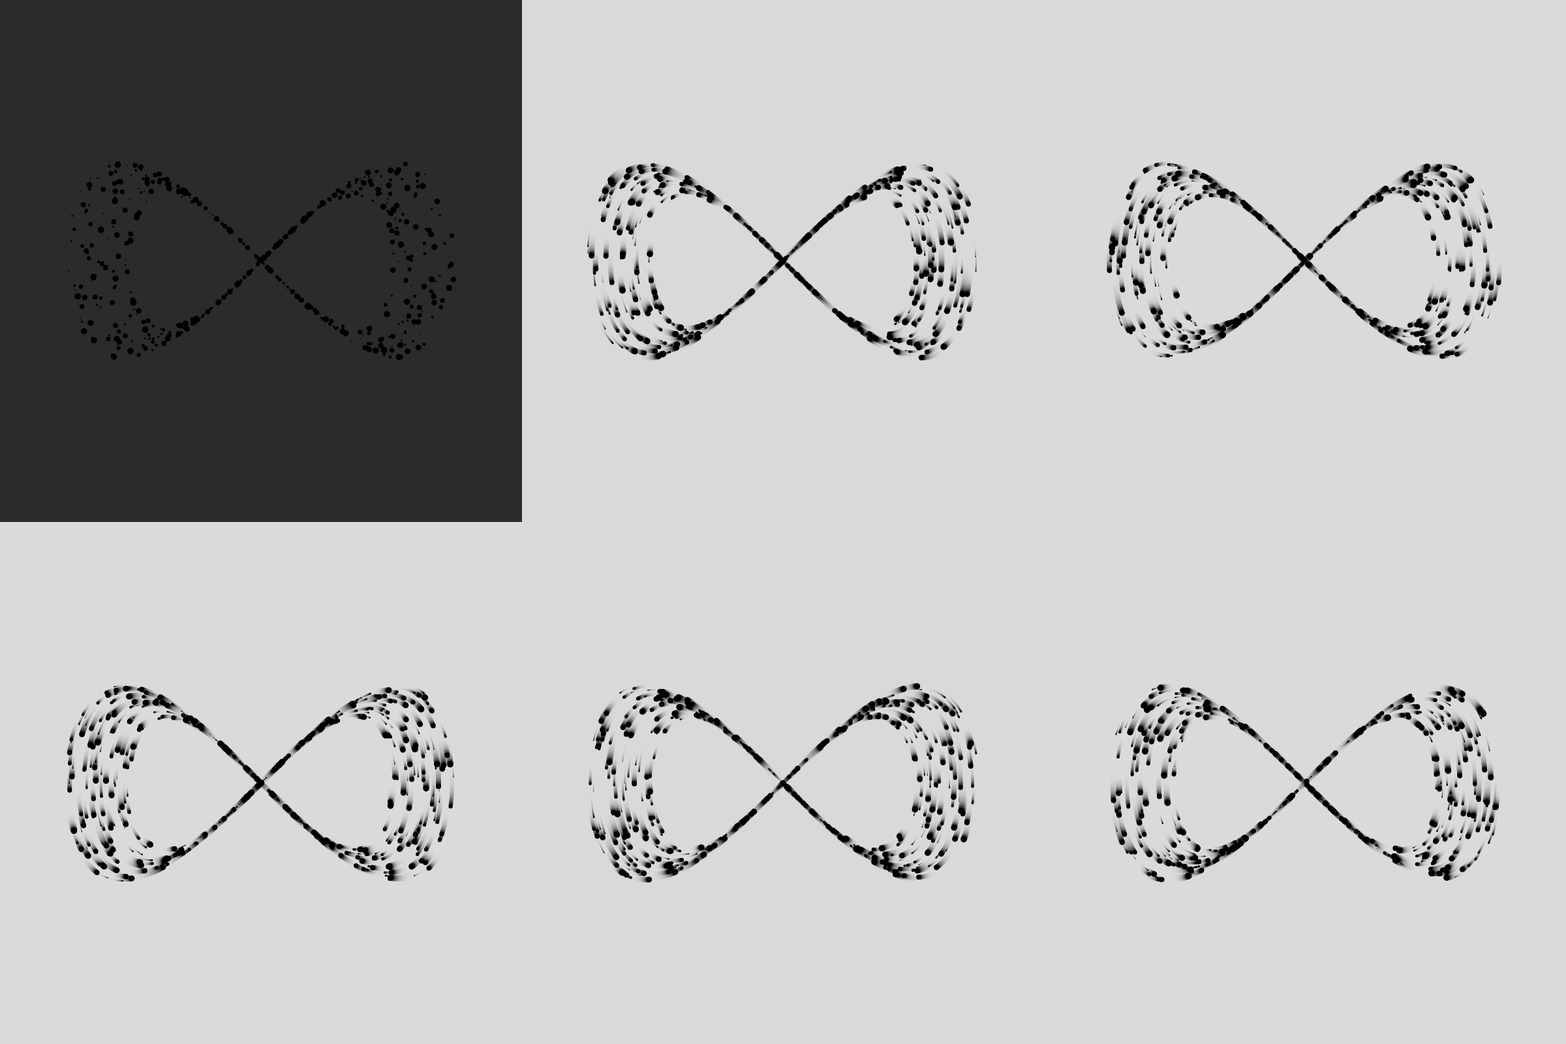
However this comes with the caveat that the first couple of frames have a faded color, which you will have to take into consideration when making GIFs.
